Difference between revisions of "ANLY482 AY2016-17 T2 Group10 Analysis & Findings"
Jxsim.2013 (talk | contribs) |
Jxsim.2013 (talk | contribs) |
||
| (2 intermediate revisions by the same user not shown) | |||
| Line 37: | Line 37: | ||
[[ANLY482_AY2016-17_T2_Group10_Analysis_&_Findings:_Analysis|<font color="#3c3c3c"><strong>Analysis</strong></font>]] | [[ANLY482_AY2016-17_T2_Group10_Analysis_&_Findings:_Analysis|<font color="#3c3c3c"><strong>Analysis</strong></font>]] | ||
| style="font-family:Century Gothic, Open Sans, Arial, sans-serif; font-size:15px; text-align: center; border:solid 1px #f5f5f5; border-radius: 7px; background-color: #fff" width="200px" | | | style="font-family:Century Gothic, Open Sans, Arial, sans-serif; font-size:15px; text-align: center; border:solid 1px #f5f5f5; border-radius: 7px; background-color: #fff" width="200px" | | ||
| − | [[ANLY482_AY2016-17_T2_Group10_Analysis_&_Findings: | + | [[ANLY482_AY2016-17_T2_Group10_Analysis_&_Findings:_Recommendations|<font color="#3c3c3c"><strong>Recommendations</strong></font>]] |
|} | |} | ||
</center> | </center> | ||
| Line 46: | Line 46: | ||
<!-- Body --> | <!-- Body --> | ||
| − | ==<div style="background: #ffffff; padding: 17px;padding:0.3em; letter-spacing:0.1em; line-height: 0.1em; text-indent: 10px; font-size:17px; text-transform:uppercase; font-weight: light; font-family: 'Century Gothic'; border-left:8px solid #1b96fe"><font color= #000000><strong>Initial Data Exploration and Analysis</strong></font></div>== | + | ==<div style="background: #ffffff; padding: 17px;padding:0.3em; letter-spacing:0.1em; line-height: 0.1em; text-indent: 10px; font-size:17px; text-transform:uppercase; font-weight: light; font-family: 'Century Gothic'; border-left:8px solid #1b96fe; margin-bottom:5px"><font color= #000000><strong>Initial Data Exploration and Analysis</strong></font></div>== |
<div style="margin:0px; padding: 10px; background: #f2f4f4; font-family: Century Gothic, Open Sans, Arial, sans-serif; border-radius: 7px; text-align:left; font-size: 15px"> | <div style="margin:0px; padding: 10px; background: #f2f4f4; font-family: Century Gothic, Open Sans, Arial, sans-serif; border-radius: 7px; text-align:left; font-size: 15px"> | ||
| − | We | + | We conducted initial data analysis using Exploratory Data Analysis (EDA) to gain general insights on key determinants that govern the relationship between interaction counts and sales revenue. We hypothesized that such factors could be “channel”, “therapy area” (sales team). |
| − | sales revenue. We hypothesized that such factors could be “channel”, “therapy area” (sales team). | ||
<br/><br/> | <br/><br/> | ||
| − | “Channel” | + | “Channel” is the classification for different types of clinics, such as General Practitioners, Restructured & Private Hospitals, Specialists. From our basic understanding, each channel has its own protocols and practices that are likely to affect receptiveness of interactions. For instance, interactions with hospital doctors may not be that impactful as that with GP doctors because hospital doctors get their drugs from a centralized system, while GP doctors have the power to make decisions for their own clinics. |
| − | its | ||
| − | because hospital doctors get their drugs from a centralized system, while GP doctors have the power to make decisions for their own clinics. | ||
<br/><br/> | <br/><br/> | ||
| − | “Therapy | + | “Therapy area” defines the name of sales teams, such as Uro CNS (Urology), Respi (Respiratory), Paed Vx (Pediatrics Vaccines), Allergy, Al Derm (Dermatology), Ad Vx (Adult Vaccines), and it decides the corresponding product brands to promote. We postulate that different drugs have different demands and established drugs may need small number of interactions to achieve good sales results whereas new types of drugs may need more interactions to achieve the same level of sales results. |
| − | and it decides the corresponding product brands to promote. We postulate that different drugs have different demands and established drugs may need small number of interactions | ||
<br/><br/> | <br/><br/> | ||
| − | To give us a better understanding of the natures of different channels and therapy areas, in this initial data analysis, we will explore | + | To give us a better understanding of the natures of different channels and therapy areas, in this initial data analysis, we will explore how sales revenue differs for different channels across different quarters and how each therapy area performs in terms of sales revenue for different channels. |
| − | across different quarters and | ||
<br/><br/> | <br/><br/> | ||
| − | Exploring sales revenue by channels and quarters allow us to understand significant demand patterns that arise from practices or secondary consumers (patients). | + | Exploring sales revenue by channels and quarters allow us to understand significant demand patterns that arise from practices or secondary consumers (patients). |
<br/><br/> | <br/><br/> | ||
| − | For | + | For instance, we will plot a line graph of total sales amount (response) against different quarters (explanatory) by different channels. |
<br/><br/> | <br/><br/> | ||
| − | + | [[File:Mattfig11.png|900px]] | |
| − | |||
<br/><br/> | <br/><br/> | ||
| − | + | A first look at the visualization gives us an understanding that there are indeed intrinsic differences across different channels and quarters. | |
| − | |||
<br/><br/> | <br/><br/> | ||
| − | + | An observation of trend across quarters is that the highest sales for most channels were made in the first quarter. This is especially prominent for pharmacy, which made more than half of the second quarter sales. To rationalize such trend, we propose two reasons, 1) higher demand from secondary consumers and 2) practice of stockpiling at the start of the year. | |
| − | + | <br/><br/> | |
| − | for | + | Exploring how each therapy area performs in terms of sales revenue for different channels can help to identify which channel each therapy area should focus on. |
| + | <br/><br/> | ||
| + | To visualize, we will plot a mosaic plot of sales revenue by therapy area and channel. | ||
| + | <br/><br/> | ||
| + | [[File:Mattfig12.png|800px]] | ||
| + | <br/><br/> | ||
| + | The use of a mosaic plot is to visualize data from two or more categorical variables in terms of a numerical variable (weight). Referencing Figure 12, x-axis shows the different channels, y-axis shows the different therapy area, area of each box depicts the proportion of sales revenue and labels shows the percentage of each therapy area when compared within a channel. | ||
| + | <br/><br/> | ||
| + | For instance, we can understand that within a channel, which therapy area generates the highest sales revenue; for Restructured Hospital, Urology team generates the highest sales revenue, for Polyclinics; Paediatrics Vaccine team generates the highest sales revenue. | ||
| + | Secondly, we can also understand how each channel fare against each other in terms of total sales revenue from its relative width; Restructured Hospital has the highest sales revenue, followed by General Practitioner. | ||
| + | <br/><br/> | ||
| + | This piece of information not only shows inherent variations in terms of sales revenue for therapy area, but also that of therapy area and channel together as it illustrates secondary consumers’ (patients) preference over certain channels when it comes to treating different illnesses. This could be important in future work of using two-way ANOVA to understand the effects of multi-factor-group impacts on sales interaction vs sales revenue. | ||
</div> | </div> | ||
<!-- End Body ---> | <!-- End Body ---> | ||
Latest revision as of 14:02, 21 April 2017
Initial Data Exploration and Analysis
We conducted initial data analysis using Exploratory Data Analysis (EDA) to gain general insights on key determinants that govern the relationship between interaction counts and sales revenue. We hypothesized that such factors could be “channel”, “therapy area” (sales team).
“Channel” is the classification for different types of clinics, such as General Practitioners, Restructured & Private Hospitals, Specialists. From our basic understanding, each channel has its own protocols and practices that are likely to affect receptiveness of interactions. For instance, interactions with hospital doctors may not be that impactful as that with GP doctors because hospital doctors get their drugs from a centralized system, while GP doctors have the power to make decisions for their own clinics.
“Therapy area” defines the name of sales teams, such as Uro CNS (Urology), Respi (Respiratory), Paed Vx (Pediatrics Vaccines), Allergy, Al Derm (Dermatology), Ad Vx (Adult Vaccines), and it decides the corresponding product brands to promote. We postulate that different drugs have different demands and established drugs may need small number of interactions to achieve good sales results whereas new types of drugs may need more interactions to achieve the same level of sales results.
To give us a better understanding of the natures of different channels and therapy areas, in this initial data analysis, we will explore how sales revenue differs for different channels across different quarters and how each therapy area performs in terms of sales revenue for different channels.
Exploring sales revenue by channels and quarters allow us to understand significant demand patterns that arise from practices or secondary consumers (patients).
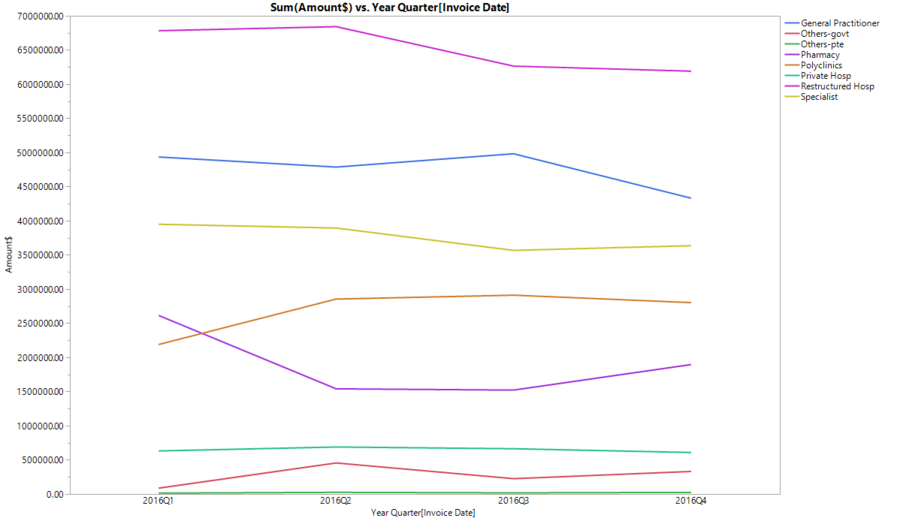
For instance, we will plot a line graph of total sales amount (response) against different quarters (explanatory) by different channels.

A first look at the visualization gives us an understanding that there are indeed intrinsic differences across different channels and quarters.
An observation of trend across quarters is that the highest sales for most channels were made in the first quarter. This is especially prominent for pharmacy, which made more than half of the second quarter sales. To rationalize such trend, we propose two reasons, 1) higher demand from secondary consumers and 2) practice of stockpiling at the start of the year.
Exploring how each therapy area performs in terms of sales revenue for different channels can help to identify which channel each therapy area should focus on.
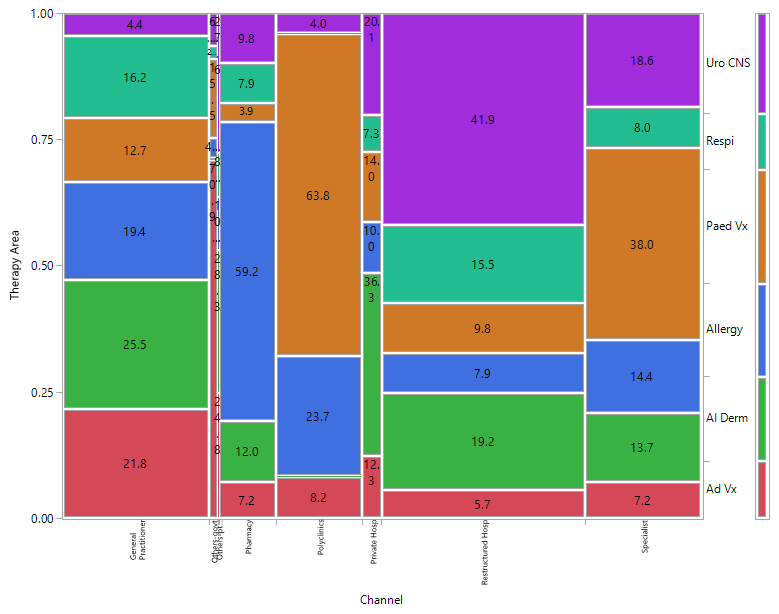
To visualize, we will plot a mosaic plot of sales revenue by therapy area and channel.

The use of a mosaic plot is to visualize data from two or more categorical variables in terms of a numerical variable (weight). Referencing Figure 12, x-axis shows the different channels, y-axis shows the different therapy area, area of each box depicts the proportion of sales revenue and labels shows the percentage of each therapy area when compared within a channel.
For instance, we can understand that within a channel, which therapy area generates the highest sales revenue; for Restructured Hospital, Urology team generates the highest sales revenue, for Polyclinics; Paediatrics Vaccine team generates the highest sales revenue.
Secondly, we can also understand how each channel fare against each other in terms of total sales revenue from its relative width; Restructured Hospital has the highest sales revenue, followed by General Practitioner.
This piece of information not only shows inherent variations in terms of sales revenue for therapy area, but also that of therapy area and channel together as it illustrates secondary consumers’ (patients) preference over certain channels when it comes to treating different illnesses. This could be important in future work of using two-way ANOVA to understand the effects of multi-factor-group impacts on sales interaction vs sales revenue.
