Difference between revisions of "ANLY482 AY2016-17 T2 Group7: Project Findings"
Yx.lim.2013 (talk | contribs) m |
|||
| (36 intermediate revisions by 2 users not shown) | |||
| Line 8: | Line 8: | ||
| style="border-bottom:7px solid #005192;" width="20%" | | | style="border-bottom:7px solid #005192;" width="20%" | | ||
| − | [[ANLY482_AY2016-17_T2_Group7: Project Overview | <font color="# | + | [[ANLY482_AY2016-17_T2_Group7: Project Overview | <font color="#bbdefb">Project Overview</font>]] |
| style="border-bottom:7px solid #febd3d;" width="20%" | | | style="border-bottom:7px solid #febd3d;" width="20%" | | ||
| − | [[ANLY482_AY2016-17_T2_Group7: | + | [[ANLY482_AY2016-17_T2_Group7: Methodology | <font color="#fff">Project Findings</font>]] |
| style="border-bottom:7px solid #005192;" width="20%" | | | style="border-bottom:7px solid #005192;" width="20%" | | ||
| Line 20: | Line 20: | ||
|} | |} | ||
<!-- End Main Navigation Bar --> | <!-- End Main Navigation Bar --> | ||
| + | |||
| + | <!--Sub Header--> | ||
| + | {| style="background-color:white; color:000000 padding: 5px 0 0 0;" width="100%" height=50px cellspacing="0" cellpadding="0" valign="top" border="0" | | ||
| + | |||
| + | | style="vertical-align:top;width:14%;" | <div style="padding: 3px; text-align:center; line-height: wrap_content; font-size:15px; border-bottom:2px solid #0163bd; font-family:Century Gothic"> [[ANLY482_AY2016-17_T2_Group7: Methodology| <b>Methodology</b>]] | ||
| + | |||
| + | | style="vertical-align:top;width:14%;" | <div style="padding: 3px; text-align:center; line-height: wrap_content; font-size:15px; border-bottom:5px solid #0163bd; font-family:Century Gothic"> [[ANLY482_AY2016-17_T2_Group7: Exploratory Data Analysis| <b>Exploratory Data Analysis</b>]] | ||
| + | |||
| + | | style="vertical-align:top;width:14%;" | <div style="padding: 3px; text-align:center; line-height: wrap_content; font-size:15px; border-bottom:2px solid #0163bd; font-family:Century Gothic"> [[ANLY482_AY2016-17_T2_Group7: Text Mining| <b>Text Analytics</b>]] | ||
| + | |||
| + | | style="vertical-align:top;width:14%;" | <div style="padding: 3px; text-align:center; line-height: wrap_content; font-size:15px; border-bottom:2px solid #0163bd; font-family:Century Gothic"> [[ANLY482_AY2016-17_T2_Group7: Gap Analysis| <b>Gap Analysis</b>]] | ||
| + | |||
| + | |} | ||
| + | <!--/Sub Header--> | ||
| + | |||
| + | <!-- Please do not make changes to above --> | ||
<br /> | <br /> | ||
| Line 27: | Line 43: | ||
<div style="color:#212121;"> | <div style="color:#212121;"> | ||
| − | [[File:BJJ1.png| | + | [[File:BJJ1.png|700px]]<br/> |
| − | Chart 1: Overall Search Counts by Month<br/> | + | ''Chart 1: Overall Search Counts by Month for All Users''<br/> |
| + | |||
| + | [[File:Overall search by existing students.png|700px]]<br/> | ||
| + | ''Chart 1.1: Overall Search by Month for Existing Students''<br/> | ||
| + | |||
| + | [[File:Search counts by existing students during academic weeks1.png|1040px]]<br/> | ||
| + | ''Chart 1.2: Search Count by Existing Students during Academic Weeks''<br/> | ||
| + | [[File:Overall search by alumni.png|700px]]<br/> | ||
| + | ''Chart 1.3: Overall Search by Month for Alumni''<br/> | ||
| − | [[File: | + | [[File:Search Counts by Alumni during Academic Weeks1.png|1040px]]<br/> |
| − | Chart | + | ''Chart 1.4: Search Count by Alumni during Academic Weeks''<br/> |
| − | |||
| − | |||
| − | <br/> | ||
| + | [[File:user_group_search_counts.jpg|300px]]<br/> | ||
| + | ''Chart 2: User Group Search Counts''<br/> | ||
| + | [[File:others_search_counts.jpg|300px]]<br/> | ||
| + | ''Chart 3: Search Count of 'Others'''<br/> | ||
{| class="wikitable" | {| class="wikitable" | ||
| Line 45: | Line 70: | ||
|- | |- | ||
| Thought Process: | | Thought Process: | ||
| − | | We want to understand the number of searches throughout the year and see if there are any observable trends. | + | | We want to understand the number of searches throughout the year and see if there are any observable trends. |
| + | Thus, we initiated the break down of the number of searches by months, to have a better look at where the peak periods are. | ||
|- | |- | ||
| Line 57: | Line 83: | ||
The overall trend of the number of searches forms the shape of a jagged mountain for both terms, thus the start and ends of the mountains fall around the start and ends of the terms. | The overall trend of the number of searches forms the shape of a jagged mountain for both terms, thus the start and ends of the mountains fall around the start and ends of the terms. | ||
| + | '''Existing Students and Alumni in Charts 1.1 & 1.3 respectively''' | ||
| + | We discovered that Chart 1 may not reveal much about who are the users who are actually performing the searches. Thus, we decided to filter by Graduation Year to showcase the Overall Search by Month for Existing Students and Alumni in Charts 1.1 & 1.3 respectively. | ||
| + | |||
| + | The filtering and classification is as follows: | ||
| + | |||
| + | {| class="wikitable" | ||
| + | |- | ||
| + | ! Graduating Year !! Type of User (Existing Student or Alumni) !! Thought Process | ||
| + | |- | ||
| + | | Null || Existing Student || This consists of users who are still far away from their graduating year | ||
| + | |- | ||
| + | | GY_2012 || Alumni || This indicates the students who have graduated in 2012 and are considered ‘alumni’ in 2016 where this dataset is based. | ||
| + | |- | ||
| + | | GY_2013 || Alumni || This indicates the students who have graduated in 2013 and are considered ‘alumni’ in 2016 where this dataset is based. | ||
| + | |- | ||
| + | | GY_2014 || Alumni || This indicates the students who have graduated in 2014 and are considered ‘alumni’ in 2016 where this dataset is based. | ||
| + | |- | ||
| + | | GY_2015 || Alumni || This indicates the students who have graduated in 2015 and are considered ‘alumni’ in 2016 where this dataset is based. | ||
| + | |- | ||
| + | | GY_2016 || Existing Student || This indicates students who are graduating in 2016 but are still considered students in the year 2016. | ||
| + | |- | ||
| + | | GY_2016 || Existing Student || This indicates students who are graduating in 2017 but are still considered students in the year 2016. | ||
| + | |} | ||
| + | |||
| + | We observed that the line chart in Chart 1.1 follows about the same shape as that of Chart 1. This could be due to existing students contributing to majority of the overall searches. | ||
| + | |||
| + | In Chart 1.3 however, the shape is vastly different from that of Chart 1. The dip after April 2016 could be due to the fact that alumnus typically receive their job offers around that period and thus are not academically involved in searching for e-resources as much as when they were still students. | ||
| + | |||
| + | '''Chart 1.2: Students in Academic Weeks''' | ||
| + | |||
| + | From Chart 1.1, we decided to generate another chart showing how students search throughout the weeks in academic terms. We observed that the peaks in the regular terms, Terms 2 and 1, occur during Week 8, which is the recess week. This could be because that majority of the students start their research during recess week. | ||
| + | |||
| + | Next, we observed that there is a decrease in the number of searches in the weeks following the recess week (Week 8) and then we noticed there is an unusual increase in the number of searches again in Week 14, which is the study week. This same trend can be seen on both Term 2 & 1. We believe that this increase in the number of searches could be due to the students performing searches as they revise for their final examinations. | ||
| + | |||
| + | '''Chart 1.4: Alumni in Academic Weeks''' | ||
| + | |||
| + | From Chart 1.4, we observed that the number of searches for Term 2 is close to none. The data for Term 1 shows no recognizable pattern. | ||
|} | |} | ||
[[File:Chart4.png|1040px]]<br/> | [[File:Chart4.png|1040px]]<br/> | ||
| − | Chart 4: Dip in Weekends for Term 2: Jan-March 2016<br/> | + | ''Chart 4: Dip in Weekends for Term 2: Jan-March 2016''<br/> |
[[File:BJJ5.png|1040px]]<br/> | [[File:BJJ5.png|1040px]]<br/> | ||
| − | Chart 5: Dip in Weekends for Term 1: Aug-Nov 2016<br/> | + | ''Chart 5: Dip in Weekends for Term 1: Aug-Nov 2016''<br/> |
[[File:Bjj6.png|1040px]]<br/> | [[File:Bjj6.png|1040px]]<br/> | ||
| − | Chart 6: Search Count by Days for Term 2: Jan-March 2016<br/> | + | ''Chart 6: Search Count by Days for Term 2: Jan-March 2016''<br/> |
[[File:Bjj6.png|1040px]]<br/> | [[File:Bjj6.png|1040px]]<br/> | ||
| − | Chart 7: Search Count by Days for Term 1: Aug-Nov 2016<br/> | + | ''Chart 7: Search Count by Days for Term 1: Aug-Nov 2016''<br/> |
[[File:Chart5.png|1040px]]<br/> | [[File:Chart5.png|1040px]]<br/> | ||
| − | Chart 7: Search Count by Days for Term 1: Aug-Nov 2016<br/> | + | ''Chart 7: Search Count by Days for Term 1: Aug-Nov 2016''<br/> |
[[File:Bjj8.png|1040px]]<br/> | [[File:Bjj8.png|1040px]]<br/> | ||
| − | Chart 8: Chinese New Year in 2016<br/> | + | ''Chart 8: Chinese New Year in 2016''<br/> |
{| class="wikitable" | {| class="wikitable" | ||
| Line 100: | Line 163: | ||
'''Highest Spike in Term 2: 11 Feb, end of CNY?''' | '''Highest Spike in Term 2: 11 Feb, end of CNY?''' | ||
| − | From Chart 7, we observed the highest spike in Term 2, which takes place on 11 Feb 2016. We could not find a possible explanation for this other than it being the end of the Chinese New Year holidays (9 & 10 Feb 2016) and students may be | + | From Chart 7, we observed the highest spike in Term 2, which takes place on 11 Feb 2016. We could not find a possible explanation for this other than it being the end of the Chinese New Year holidays (9 & 10 Feb 2016) and students may be picking up on their research, thus explaining the spike in number of searches performed on 11 Feb 2016. |
| − | |||
|} | |} | ||
| − | [[File:Percent_of_Search_Counts_by_Degrees_in_Weekends.png]]<br/> | + | [[File:Percent_of_Search_Counts_by_Degrees_in_Weekends.png|800px]]<br/> |
| − | Chart 9: Percentage of Search Counts by Degrees in Weekends for Term 2: Jan-March 2016<br/> | + | ''Chart 9: Percentage of Search Counts by Degrees in Weekends for Term 2: Jan-March 2016''<br/> |
| − | [[File:Percent_of_Search_Counts_by_Degrees_in_Weekends_from_Sep_to_Dec.png]]<br/> | + | [[File:Percent_of_Search_Counts_by_Degrees_in_Weekends_from_Sep_to_Dec.png|800px]]<br/> |
| − | Chart 10: Percentage of Search Counts by Degrees in Weekends for Term 1: Sep to Nov 2016<br/> | + | ''Chart 10: Percentage of Search Counts by Degrees in Weekends for Term 1: Sep to Nov 2016''<br/> |
{| class="wikitable" | {| class="wikitable" | ||
| Line 126: | Line 188: | ||
In Chart 10, we can observe that the abovementioned trend is consistent for students in the Bachelor of Laws, Bachelor of Business Management and Juris Doctor. Thus, our trend analysis holds consistent for both Terms 1 and 2. | In Chart 10, we can observe that the abovementioned trend is consistent for students in the Bachelor of Laws, Bachelor of Business Management and Juris Doctor. Thus, our trend analysis holds consistent for both Terms 1 and 2. | ||
| − | |||
|} | |} | ||
| − | |||
| − | |||
| − | |||
| − | |||
| − | |||
| − | |||
| − | |||
| − | |||
| − | |||
| − | |||
| − | |||
| − | |||
| − | |||
| − | |||
| − | |||
| − | |||
| − | |||
| − | |||
| − | |||
| − | |||
| − | |||
| − | |||
<br/> | <br/> | ||
| − | [[File:usage_of_databases_by_schools.jpg]]<br/> | + | [[File:usage_of_databases_by_schools.jpg|900px]]<br/> |
| − | Chart | + | ''Chart 11: Usage of Database by Schools''<br/> |
| − | |||
| − | |||
| − | |||
| − | |||
| − | |||
| − | |||
| − | |||
| − | |||
| − | |||
| − | |||
| − | |||
| − | |||
| − | |||
| − | |||
| − | |||
| − | |||
| − | |||
| − | |||
| − | |||
| − | |||
| − | |||
| − | |||
| − | |||
| − | |||
| − | |||
| − | |||
| − | |||
| − | |||
| − | |||
| − | |||
| − | |||
| − | |||
| − | |||
| − | |||
| − | |||
| − | |||
| − | |||
| − | |||
| − | |||
| − | |||
| − | |||
| − | |||
| − | |||
| − | |||
| − | |||
| − | |||
| − | |||
| − | |||
| − | |||
| − | |||
| − | |||
| − | |||
| − | |||
| − | |||
| − | |||
| − | |||
| − | |||
| − | |||
| − | |||
| − | |||
| − | |||
| − | |||
| − | |||
| − | |||
| − | |||
| − | |||
| − | |||
| − | |||
| − | |||
| − | |||
| − | |||
| − | |||
| − | |||
| − | |||
| − | |||
| − | |||
| − | |||
| − | |||
| − | |||
| − | |||
| − | |||
| − | |||
| − | |||
| − | |||
| − | |||
| − | |||
| − | |||
| − | |||
| − | |||
| − | |||
| − | |||
| − | |||
| − | |||
| − | |||
Latest revision as of 02:40, 7 April 2017
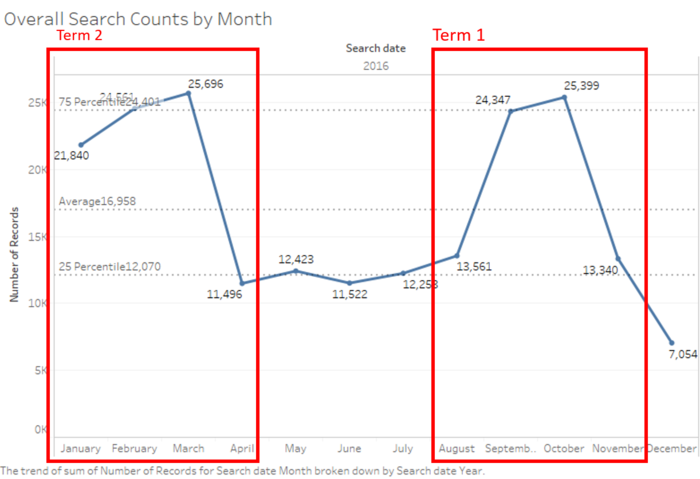
Chart 1: Overall Search Counts by Month for All Users
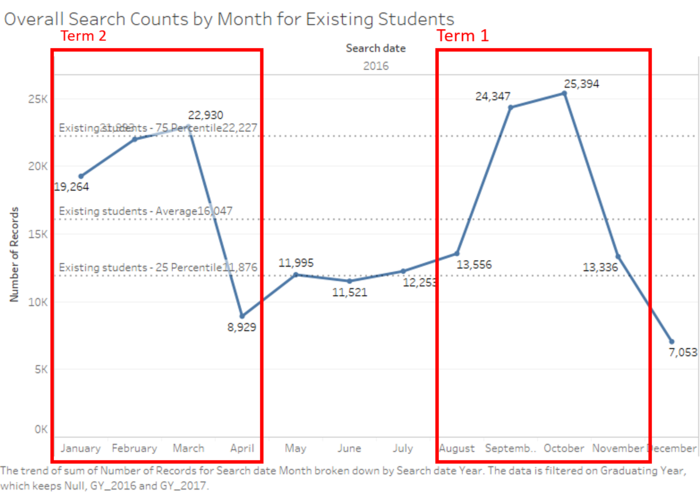
Chart 1.1: Overall Search by Month for Existing Students

Chart 1.2: Search Count by Existing Students during Academic Weeks
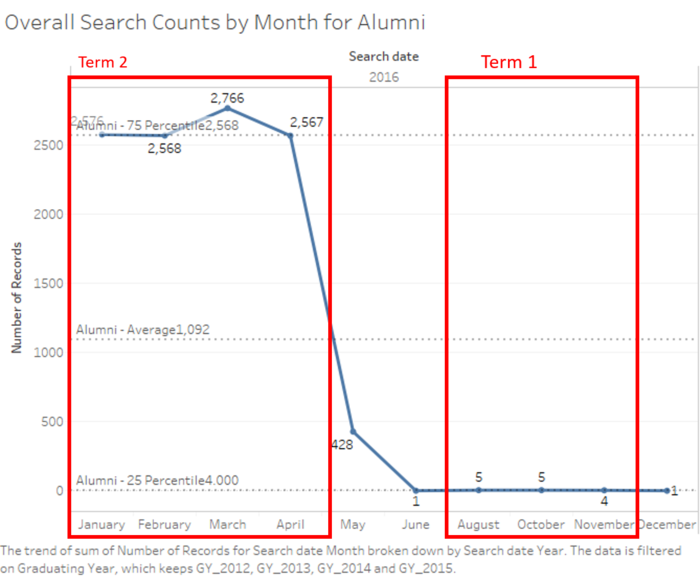
Chart 1.3: Overall Search by Month for Alumni
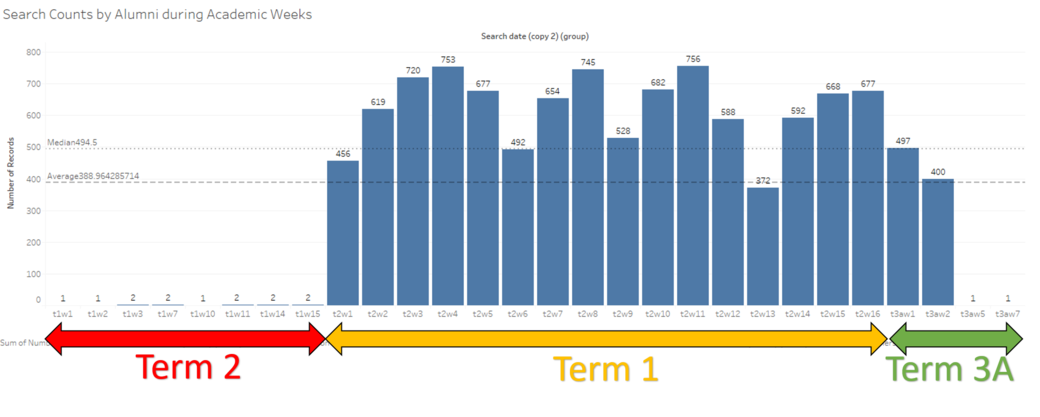
Chart 1.4: Search Count by Alumni during Academic Weeks
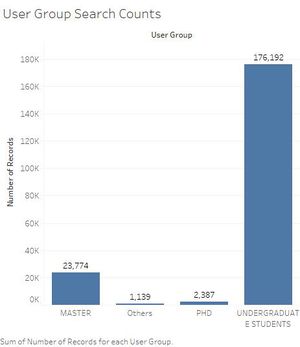
Chart 2: User Group Search Counts
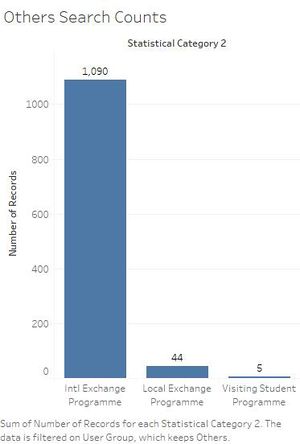
Chart 3: Search Count of 'Others'
| Subject Matter: | Awareness of the number of searches throughout the year | ||||||||||||||||||||||||
| Thought Process: | We want to understand the number of searches throughout the year and see if there are any observable trends.
Thus, we initiated the break down of the number of searches by months, to have a better look at where the peak periods are. | ||||||||||||||||||||||||
| Analysis: | There is great variation in the number of searches across the span of a year, and these searches on the Ezproxy are contributed by students - Undergraduate, Masters, PhD and others (international exchange, local exchange, visiting students). As the users of the Ezproxy site are students of Singapore Management University, the spike in the number of searches can be seen during the months of the regular semesters (Term 1 and 2) - January to March and Mid-August to November.
Identifying the start and end of regular terms just by looking at the number of searches In Chart 1, we could potentially identify the start and end of the 2 regular terms just by observing where the number of searches experience a gradual dip. The overall trend of the number of searches forms the shape of a jagged mountain for both terms, thus the start and ends of the mountains fall around the start and ends of the terms. Existing Students and Alumni in Charts 1.1 & 1.3 respectively We discovered that Chart 1 may not reveal much about who are the users who are actually performing the searches. Thus, we decided to filter by Graduation Year to showcase the Overall Search by Month for Existing Students and Alumni in Charts 1.1 & 1.3 respectively. The filtering and classification is as follows:
We observed that the line chart in Chart 1.1 follows about the same shape as that of Chart 1. This could be due to existing students contributing to majority of the overall searches. In Chart 1.3 however, the shape is vastly different from that of Chart 1. The dip after April 2016 could be due to the fact that alumnus typically receive their job offers around that period and thus are not academically involved in searching for e-resources as much as when they were still students. Chart 1.2: Students in Academic Weeks From Chart 1.1, we decided to generate another chart showing how students search throughout the weeks in academic terms. We observed that the peaks in the regular terms, Terms 2 and 1, occur during Week 8, which is the recess week. This could be because that majority of the students start their research during recess week. Next, we observed that there is a decrease in the number of searches in the weeks following the recess week (Week 8) and then we noticed there is an unusual increase in the number of searches again in Week 14, which is the study week. This same trend can be seen on both Term 2 & 1. We believe that this increase in the number of searches could be due to the students performing searches as they revise for their final examinations. Chart 1.4: Alumni in Academic Weeks From Chart 1.4, we observed that the number of searches for Term 2 is close to none. The data for Term 1 shows no recognizable pattern. |

Chart 4: Dip in Weekends for Term 2: Jan-March 2016

Chart 5: Dip in Weekends for Term 1: Aug-Nov 2016

Chart 6: Search Count by Days for Term 2: Jan-March 2016

Chart 7: Search Count by Days for Term 1: Aug-Nov 2016

Chart 7: Search Count by Days for Term 1: Aug-Nov 2016

Chart 8: Chinese New Year in 2016
| Subject Matter: | Understanding the students’ behaviours in searches during the semesters. |
| Thought Process: | In SMU, 1 of the common perception is that SMU students study all day everyday, even the weekends. Thus, we want to see if this perception of SMU students is indeed true.
Next, we want to see if there is a surge in searches when the semester reaches the week where group projects are released. This is because projects in SMU largely requires the students to perform desk research and 1 of the many places to do so is through the SMU library’s EzProxy e-resources database. |
| Analysis: | Dip in Weekend Searches
From the Chart 3 & 4,, we noticed that there is a dip in the number of searches performed every weekend (Saturdays & Sundays). For example, there is a plunge in the number of searches on 16th of January (Saturday). Thus, this may show that the perception of SMU students studying all day everyday and even the weekends may be untrue. Or it could be that SMU students generally do not perform as many searches for their research on weekends. Research on Recess Week? However, upon further contrasting of the trends in Charts 5 and 6 side-by-side, we discovered that there is always a spike in the number of searches on the first day of Recess week in both Terms. For Term 2, Recess week starts on 22 Feb where there is a visible spike from 21 Feb to 22 Feb. And for Term 1, Recess week starts on 3 Oct where there is also a visible spike from 2 Oct to 3 Oct (this spike happens to be the highest in the entire Term 1). And in both cases, the number of searches decreases gradually until the end of the Recess Week (28 Feb for Term 2 and 9 Oct for Term 1 respectively). This is a very interesting discovery as it potentially shows that students typically start their research on the first day of Recess week, thereby contributing to the spike in number of searches, and then as the Recess week comes to a close, the amount of research students performed becomes lesser too. Highest Spike in Term 2: 11 Feb, end of CNY? From Chart 7, we observed the highest spike in Term 2, which takes place on 11 Feb 2016. We could not find a possible explanation for this other than it being the end of the Chinese New Year holidays (9 & 10 Feb 2016) and students may be picking up on their research, thus explaining the spike in number of searches performed on 11 Feb 2016. |
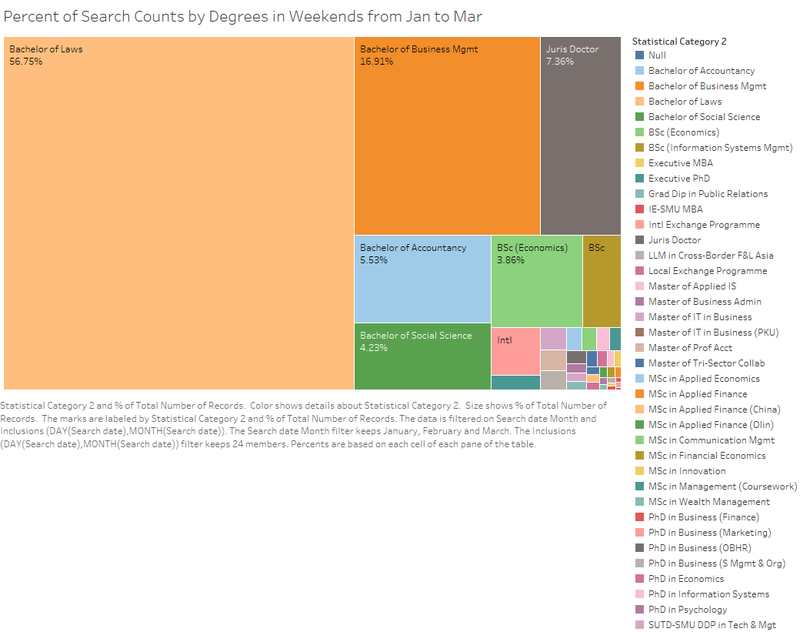
Chart 9: Percentage of Search Counts by Degrees in Weekends for Term 2: Jan-March 2016
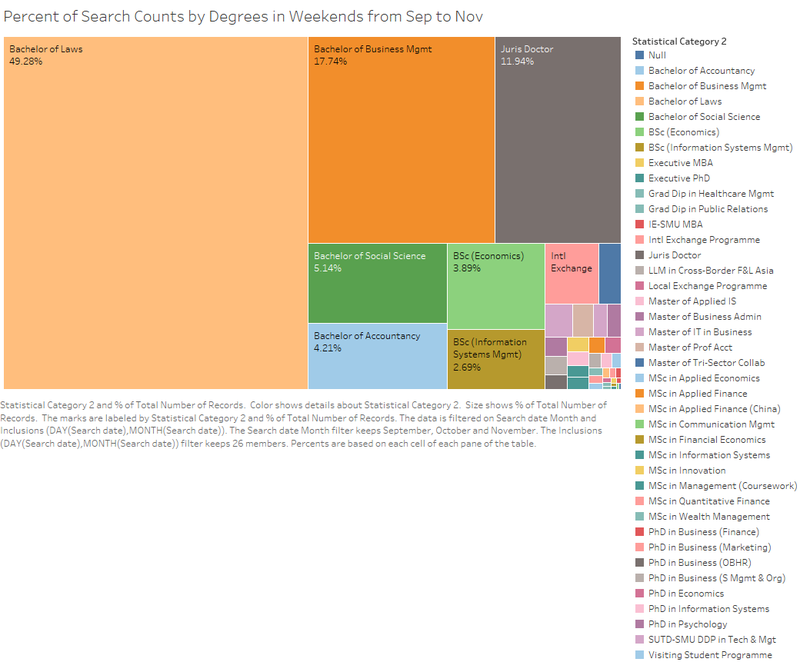
Chart 10: Percentage of Search Counts by Degrees in Weekends for Term 1: Sep to Nov 2016
| Subject Matter: | Understanding the percentage of searches contributed by students across their Degrees during weekends |
| Thought Process: | We want to dive deeper into the analysis of weekend searches and find out who are the ones still contributing to it, despite the dip in number of weekend searches. |
| Analysis: | In Chart 9, we noticed that 56.75% of searches were done by students enrolled in the Bachelor of Laws programme, which occupies a majority of the total number of searches performed on weekends. Additionally, 16.91% of searches were done by students from Bachelor of Business Management and 7.36% from the Juris Doctor programme.
One of the possible conclusions from this observation is that students enrolled in the Law field (Bachelor of Laws & Juris Doctor programme) do not typically stop performing searches and/or stop researching simply because it is the weekends. In addition to that, students in the Bachelor of Business Management programme contributes significantly to the number of searches on weekends too, perhaps due to the nature of the programme which is research-intensive. This is in contrast to students from other non-research intensive programmes such as Bachelor of Science (Information Systems) at 1.64% of total number of searches. In Chart 10, we can observe that the abovementioned trend is consistent for students in the Bachelor of Laws, Bachelor of Business Management and Juris Doctor. Thus, our trend analysis holds consistent for both Terms 1 and 2. |
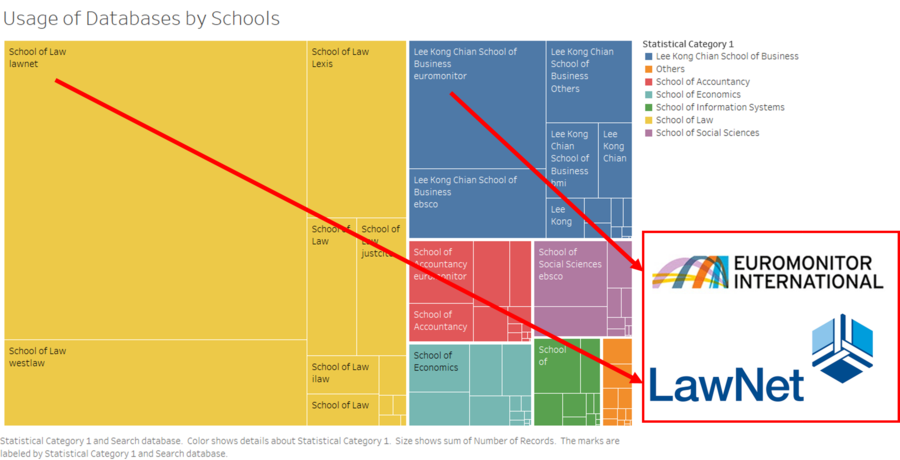
Chart 11: Usage of Database by Schools