Difference between revisions of "ANLY482 AY2016-17 T2 Group19 Findings"
| Line 55: | Line 55: | ||
<div style="text-align: justify;"> | <div style="text-align: justify;"> | ||
| − | ==Sales Trends on a Product Level== | + | ==GP Sales Trends on a Product Level== |
Analysis was conducted for categories of products which contributed 10% or more to the total sales aggregated for the years 2014 - 2016. | Analysis was conducted for categories of products which contributed 10% or more to the total sales aggregated for the years 2014 - 2016. | ||
| − | [[File:6 Category Sales.png| | + | [[File:6 Category Sales.png|500px|center]] |
| + | We note that overall GP sales have been increasing but growth was slower in 2016 as compared to 2015. On the category level there is an overall increase in sales for all categories except Dermatological Therapy. As the thickness of the lines indicate the quantity of the products sold, it can be inferred that Genito-Urinary System products are being sold at higher prices as compared to the other categories. | ||
| + | A possible explanation regarding the increasing trends could be that more patients are seeing GPs for treatment of diseases which fall under those categories. For the decreasing trends, one possible explanation is that patients with illnesses that can be treated with Dermatological Therapy drugs are visiting specialist clinics instead of GPs. Further investigation into each category which contributed 10% of more of total sales and their respective subcategories will be conducted to discover the revenue drivers and any existing seasonal trends if any. | ||
=<div style="background: #4d4d4d; padding: 20px; line-height: 0.1em; text-indent: 10px; font-size:20px; font-family: Trajan Pro; border-radius: 7px; border-bottom:3px solid #ba3749"><font color= #ffffff>Final</font></div>= | =<div style="background: #4d4d4d; padding: 20px; line-height: 0.1em; text-indent: 10px; font-size:20px; font-family: Trajan Pro; border-radius: 7px; border-bottom:3px solid #ba3749"><font color= #ffffff>Final</font></div>= | ||
Revision as of 17:41, 27 February 2017
Contents
Exploratory Data Analysis
Contextual Approach
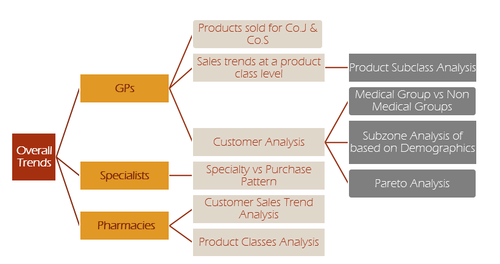
The main focus of Exploratory Data Analysis for the given dataset is to understand and to uncover any purchasing patterns relating to a variety of specific groups of customers. In that regard, our team has identified three main types of customers to focus on and has conducted their respective analyses as shown in the following diagram.
Sales Trends for Company J and S
The names of these companies have been redacted in accordance to the terms and conditions of the Non-Disclosure Agreement (NDA). Nevertheless, Company Z has been engaged by various pharmaceutical companies who wish to utilise Company Z's distribution network by selling medical products on their behalf. A comparison of their sales trends against Company Z's sales trends was done so as to gauge their performance.
Company J only sells products belonging to "Other Dermatologicals" subcategory and Company S only sells products belonging to "Vaccines, Antisera & Immunologicals" subcategory. These sales are compared to Company Z's own sales in those subcategories to better gauge their performance. Sales figures are not to be released in accordance to the terms and conditions of the NDA, however Company S sales has decreased while Company Z's sales have increased during 2014 - 2016, the opposite is observed for Company J where its own sales have increased while Company Z's sales have decreased. A possible explanation for the observed trend is that, demand for Company S's products is decreasing due to Company Z’s customers switching to their competitors products for better prices.
GP Sales Trends on a Product Level
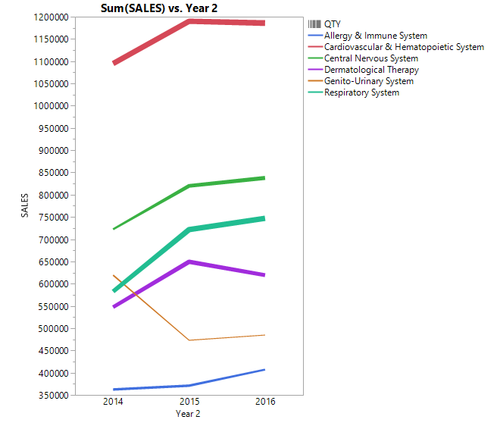
Analysis was conducted for categories of products which contributed 10% or more to the total sales aggregated for the years 2014 - 2016.
We note that overall GP sales have been increasing but growth was slower in 2016 as compared to 2015. On the category level there is an overall increase in sales for all categories except Dermatological Therapy. As the thickness of the lines indicate the quantity of the products sold, it can be inferred that Genito-Urinary System products are being sold at higher prices as compared to the other categories. A possible explanation regarding the increasing trends could be that more patients are seeing GPs for treatment of diseases which fall under those categories. For the decreasing trends, one possible explanation is that patients with illnesses that can be treated with Dermatological Therapy drugs are visiting specialist clinics instead of GPs. Further investigation into each category which contributed 10% of more of total sales and their respective subcategories will be conducted to discover the revenue drivers and any existing seasonal trends if any.
Final
Stuff


