Difference between revisions of "Analysis and Findings as of Finals"
| Line 129: | Line 129: | ||
! Dataset !! R-Square !! RMSE | ! Dataset !! R-Square !! RMSE | ||
|- | |- | ||
| − | | Train Data || 0. | + | | Train Data || 0.864 || 4000.27 |
|- | |- | ||
| − | | Validation Data || 0. | + | | Validation Data || 0.810 || 4673.70 |
|- | |- | ||
| − | | Test Data || 0. | + | | Test Data || 0.814 || 4625.73 |
|- | |- | ||
|} | |} | ||
| Line 143: | Line 143: | ||
! Dataset !! R-Square !! RMSE | ! Dataset !! R-Square !! RMSE | ||
|- | |- | ||
| − | | Train Data || 0. | + | | Train Data || 0.818 || 4629.6 |
|- | |- | ||
| − | | Validation Data || 0. | + | | Validation Data || 0.771 || 5135.6 |
|- | |- | ||
| − | | Test Data || 0. | + | | Test Data || 0.802 || 4774.6 |
|- | |- | ||
|} | |} | ||
Revision as of 19:20, 1 December 2016
| Mid-Term | Finals |
|---|
As from the Data Exploration phase up till Mid-Terms, our team has realized that there are numerous factors that will possibly each of the different events. Therefore, our team has decided to put forward the factors, as shown in the table below, which will be used to assist us in building predictive models to explain the variations in the demands or tickets sold for each event.
| No. | Factors | Description |
|---|---|---|
| 1 | Concurrent Events | Our team is hypothesizing that the events, which started at the same time period will make people buy less tickets. There might be a possibility that if there are more concurrent events ongoing, the demand may be split across the concurrent events. |
| 2 | Day of Week | The day of the week will also potentially affect the demands for each event, as events which are held in the weekdays may be attract less customers than events held over the weekends. |
| 3 | Event Name | As from our Exploratory Analysis, we realized that each of the events perform differently, and there are a multitude of factors which affects its variations in demands. |
| 4 | Time Period | Our team chose to divide 24-hours in a single day to 3-hours time block (e.g., 12AM to 2:59AM as Early Midnight & 3AM to 5:59AM as Late Midnight), as different customers might prefer events due to their lifestyle. |
| 5 | Month | The month factor is important as there might be a possibility that certain months, such as the holiday or festive season, which will potentially attract more customers to buy tickets for the different events. |
With all the identified factors, our team prepared the data to be in a suitable data structure to be fed into our predictive model in the Model Calibration and Validation phase.
In this phase, our team has identified 4 different models, and the aim of this phase is to calibrate the identified models based on the above derived variables and evaluate its performance through the Root Mean Square Error (RMSE).
The list below shows the 4 different models identified:
- Regression Model
- Decision Tree Model
- Boosted Tree Model
- Bootstrap Forest Model
Out of the 4 models above, all the models other than Regression Model are classified as eager learners. Since there is no provision of train and test datasets, our team will need to craft our own datasets with the following proportions as shown below:
| Dataset | Proportion |
|---|---|
| Train Data | 50% |
| Validation Data | 20% |
| Test Data | 30% |
- Regression Model
The Regression Model allows us to explore and understand the relationship between a dependent variable (in our case, this is the tickets sold) and one or more independent variables (in this case, this is the derived variables in the previous subsection).
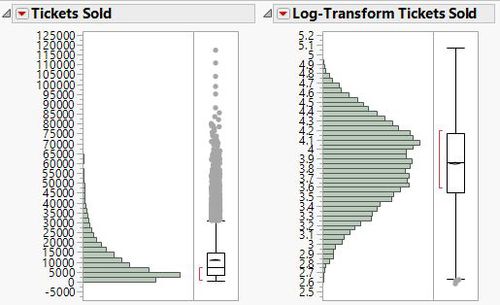
Prior to the calibration of the model, our team has decided to log-transform the number of tickets sold to assume a normal distribution, so that our model will not be dominated by extreme values.
As from the model calibrated based on the derived variables, our team managed to achieve a decent result as shown in the table below.
| Dataset | R-Square | RMSE |
|---|---|---|
| Train Data | 0.747 | 0.213 |
| Validation Data | 0.742 | 0.214 |
| Test Data | 0.746 | 0.211 |
- Decision Tree Model
| Dataset | R-Square | RMSE |
|---|---|---|
| Train Data | 0.813 | 4691.75 |
| Validation Data | 0.775 | 5094.41 |
| Test Data | 0.783 | 5003.52 |
- Boosted Tree Model
| Dataset | R-Square | RMSE |
|---|---|---|
| Train Data | 0.864 | 4000.27 |
| Validation Data | 0.810 | 4673.70 |
| Test Data | 0.814 | 4625.73 |
- Bootstrap Forest Model
| Dataset | R-Square | RMSE |
|---|---|---|
| Train Data | 0.818 | 4629.6 |
| Validation Data | 0.771 | 5135.6 |
| Test Data | 0.802 | 4774.6 |
