Difference between revisions of "ANLY482 AY2016-17 T1 Group1: PROJECT FINDINGS"
| Line 68: | Line 68: | ||
The second challenge is that a manual identification of video post’s data based on the source of the video. A video posted on SGAG’s page could be in-house generated (by SGAG) or Shared Video (by other Facebook Users/Public). The identification of the source depends on keywords and the characters appeared in the video. For instance, a video post is considered a shared video if the post message of the video contains words such as “credit to” or “submitted by” <name>. On the other hand, characteristics of an in-house generated video is when any of the SGAG characters appeared in the video (e.g. Xiao Ming, Sue-Ann). When a video does not possess any of the characteristics mentioned above, our team would have to confirm the source of the video with our sponsor, Mr. Karl. | The second challenge is that a manual identification of video post’s data based on the source of the video. A video posted on SGAG’s page could be in-house generated (by SGAG) or Shared Video (by other Facebook Users/Public). The identification of the source depends on keywords and the characters appeared in the video. For instance, a video post is considered a shared video if the post message of the video contains words such as “credit to” or “submitted by” <name>. On the other hand, characteristics of an in-house generated video is when any of the SGAG characters appeared in the video (e.g. Xiao Ming, Sue-Ann). When a video does not possess any of the characteristics mentioned above, our team would have to confirm the source of the video with our sponsor, Mr. Karl. | ||
| − | <big>''' | + | <big>'''Choice of Key Measurements'''</big><br/> |
In our analysis, measurements such as Reach, Engagement, Impressions, Likes, Unlikes, Comments, Shares, Negative Feedbacks, and various length of Video Views have been chosen to be the key performance indicators. Measurements such as Lifetime Post Paid Reach and Lifetime Post Total Reach will not be used as performance measurements as there is no paid posts in SGAG’s dataset. Hence, the amount of organic reach would be the same as total reach and paid post reach will always be 0. As such measurements would be redundant and meaningless in our analysis, we have then excluded it from our analytical dataset. | In our analysis, measurements such as Reach, Engagement, Impressions, Likes, Unlikes, Comments, Shares, Negative Feedbacks, and various length of Video Views have been chosen to be the key performance indicators. Measurements such as Lifetime Post Paid Reach and Lifetime Post Total Reach will not be used as performance measurements as there is no paid posts in SGAG’s dataset. Hence, the amount of organic reach would be the same as total reach and paid post reach will always be 0. As such measurements would be redundant and meaningless in our analysis, we have then excluded it from our analytical dataset. | ||
| Line 82: | Line 82: | ||
: 1. '''Missing Values''' : | : 1. '''Missing Values''' : | ||
: After examining the dataset, a few missing values can be found at page level dataset, and no missing values are found at the post and video level dataset. As the missing columns in the page level dataset contains measures such as lifetime likes and daily demographics data that is critical in the evaluation of SGAG’s overall daily performance, these dates (26 January 2016, 28 & 29 August 2016) will be removed from our subsequent page level analysis. | : After examining the dataset, a few missing values can be found at page level dataset, and no missing values are found at the post and video level dataset. As the missing columns in the page level dataset contains measures such as lifetime likes and daily demographics data that is critical in the evaluation of SGAG’s overall daily performance, these dates (26 January 2016, 28 & 29 August 2016) will be removed from our subsequent page level analysis. | ||
| + | <br/> | ||
: 2. '''Duplicate Values''' : | : 2. '''Duplicate Values''' : | ||
: There is no duplicate found at the page level data. However, a handful of row duplications and post message duplications can be found at both post and video level dataset. Some of the common issues found are as following: | : There is no duplicate found at the page level data. However, a handful of row duplications and post message duplications can be found at both post and video level dataset. Some of the common issues found are as following: | ||
| Line 91: | Line 92: | ||
[[File:ANLY482_Group1_Figure2_2.png|500px|center]] | [[File:ANLY482_Group1_Figure2_2.png|500px|center]] | ||
:: As seen in Figure 2.2, various columns such as Post ID, Permalink and Post Message are the same across the two rows. Hence, we will remove one of the rows in our dataset for such situations. | :: As seen in Figure 2.2, various columns such as Post ID, Permalink and Post Message are the same across the two rows. Hence, we will remove one of the rows in our dataset for such situations. | ||
| + | |||
| + | :: '''iii. Cover Photo and Timeline Photo Update''' | ||
| + | :: Besides some of the common duplication issues mentioned above, we have also discovered that there are updates such as cover photo and profile picture update that result in the duplication of post messages. As this posts are only update of SGAG’s Facebook profile, they are not an indicator of SGAG’s performance and thus, will be removed from our further study. | ||
| + | <br/> | ||
| + | : 3. '''Outlier''' : | ||
| + | : Outlier in this project is defined as posts or dates that have significantly better or worse performance as compared to average SGAG Facebook posts’ performance. These posts go viral and perform exceptionally well due to certain special events such as the launch of Pokémon game in Singapore. As much as these posts generated high reach and engagement for SGAG, they are dominant and will potentially influence the results of our findings. Consequently, these posts will be excluded from our study. Figure 2.3, 2.4 and 2.5 below show the examples of outliers if page, post and video level data set respectively. | ||
| + | [[File:ANLY482_Group1_Figure2_3.png|500px|center]] | ||
| + | [[File:ANLY482_Group1_Figure2_4.png|500px|center]] | ||
| + | [[File:ANLY482_Group1_Figure2_5.png|500px|center]] | ||
<big>'''Exploration'''</big><br/> | <big>'''Exploration'''</big><br/> | ||
| − | + | Our team started off by looking at the changes in SGAG’s audience base from August 2015 to August 2016. Lifetime Total Likes is used to assess the growth or decline in their audience. | |
| + | '''Maximum Monthly Total Likes''' | ||
| + | [[File:ANLY482_Group1_Figure3_1.png|500px|center]] | ||
</font></div> | </font></div> | ||
<div style="height: 2em"></div> | <div style="height: 2em"></div> | ||
<!--/Content--> | <!--/Content--> | ||
Revision as of 20:12, 16 October 2016
To facilitate the data analysis, SGAG provided our team with the datasets of their two main social media channels which are Facebook and Twitter. Both of the datasets are obtained through the social media insights of the respective platform, ranging from September 2015 to August 2016.
Some instances of the datasets that are provided to us are SGAG Facebook Page Level Insights, Post Level Insights, Video Posts Insights and SGAG Twitter Activity Metrics.
Howerver, due to the time constraint, our team will only be focusing on Facebook.
Extracted Table
Some columns in the original dataset were extracted to a new table as the original form does not serve to perform comparison analysis.
The figure above is a snippet of how lifetime likes by gender and age were stored in the original Page Level dataset. Lifetime Likes by Gender and Age stores an aggregated demographic data about the unique Facebook users who like SGAG's Page based on the age and gender information they provide in their user profiles. The original format does not allow a comparison of changes in daily likes of a gender by different age groups and also gained in daily likes.
Hence, we extracted the data into the following table and calculated the differences in daily likes in order to achieve our objective:
Challenges
The first challenge that team encountered was to perform a manual reconciliation of advertiser’s data to the post’s data (advertisement) as the information of the advertisers and the relevant posts to the advertiser were available via a dropbox link stored in another Microsoft Excel spreadsheet.
The second challenge is that a manual identification of video post’s data based on the source of the video. A video posted on SGAG’s page could be in-house generated (by SGAG) or Shared Video (by other Facebook Users/Public). The identification of the source depends on keywords and the characters appeared in the video. For instance, a video post is considered a shared video if the post message of the video contains words such as “credit to” or “submitted by” <name>. On the other hand, characteristics of an in-house generated video is when any of the SGAG characters appeared in the video (e.g. Xiao Ming, Sue-Ann). When a video does not possess any of the characteristics mentioned above, our team would have to confirm the source of the video with our sponsor, Mr. Karl.
Choice of Key Measurements
In our analysis, measurements such as Reach, Engagement, Impressions, Likes, Unlikes, Comments, Shares, Negative Feedbacks, and various length of Video Views have been chosen to be the key performance indicators. Measurements such as Lifetime Post Paid Reach and Lifetime Post Total Reach will not be used as performance measurements as there is no paid posts in SGAG’s dataset. Hence, the amount of organic reach would be the same as total reach and paid post reach will always be 0. As such measurements would be redundant and meaningless in our analysis, we have then excluded it from our analytical dataset.
Issues
Several problems such as duplication of data, missing values and outliers can be found in the dataset collected from SGAG. As these issues will potentially affect the result of our analysis, suitable actions will be taken to handle such issues prior to performing our analysis.
- 1. Missing Values :
- After examining the dataset, a few missing values can be found at page level dataset, and no missing values are found at the post and video level dataset. As the missing columns in the page level dataset contains measures such as lifetime likes and daily demographics data that is critical in the evaluation of SGAG’s overall daily performance, these dates (26 January 2016, 28 & 29 August 2016) will be removed from our subsequent page level analysis.
- 2. Duplicate Values :
- There is no duplicate found at the page level data. However, a handful of row duplications and post message duplications can be found at both post and video level dataset. Some of the common issues found are as following:
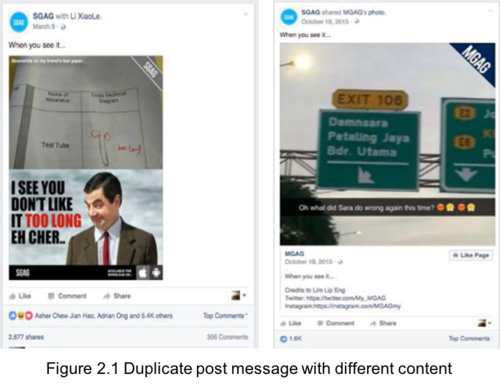
- i. Same Post Message with Different Content
- Figure 2.1 shows two posts that are described by exactly the same post message. After looking into the posts, we realized that both of the posts are of different content and therefore, will retain such posts in our further analysis.
- ii. Identical Rows
- As seen in Figure 2.2, various columns such as Post ID, Permalink and Post Message are the same across the two rows. Hence, we will remove one of the rows in our dataset for such situations.
- iii. Cover Photo and Timeline Photo Update
- Besides some of the common duplication issues mentioned above, we have also discovered that there are updates such as cover photo and profile picture update that result in the duplication of post messages. As this posts are only update of SGAG’s Facebook profile, they are not an indicator of SGAG’s performance and thus, will be removed from our further study.
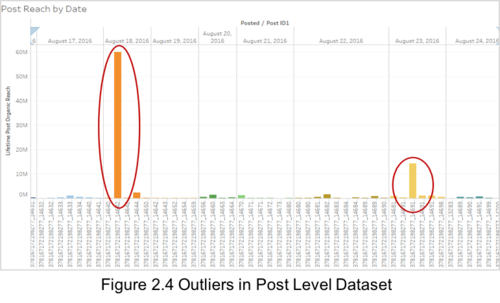
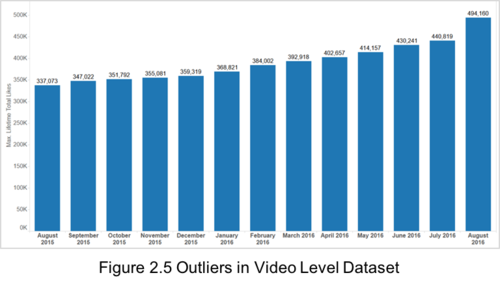
- 3. Outlier :
- Outlier in this project is defined as posts or dates that have significantly better or worse performance as compared to average SGAG Facebook posts’ performance. These posts go viral and perform exceptionally well due to certain special events such as the launch of Pokémon game in Singapore. As much as these posts generated high reach and engagement for SGAG, they are dominant and will potentially influence the results of our findings. Consequently, these posts will be excluded from our study. Figure 2.3, 2.4 and 2.5 below show the examples of outliers if page, post and video level data set respectively.
Exploration
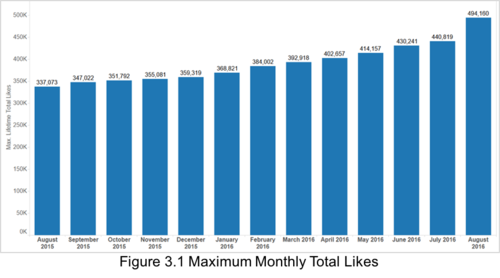
Our team started off by looking at the changes in SGAG’s audience base from August 2015 to August 2016. Lifetime Total Likes is used to assess the growth or decline in their audience.
Maximum Monthly Total Likes


