Group09 proposal
Contents
Abstract
Objective
Data Source
Visualization
- Time series: The‘highcharter',‘plotly',‘viridis',‘scatterplot3' and‘ggplot2’packages will be employed to create two interactive time series line charts, revealing how the historical and future global CO2 emission and temperature change during different period.
- World map: Same packages as mentioned above will be applied to generate two interactive world maps, showing and comparing the CO2 emission in different country and year respectively.
Methodology
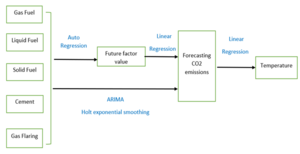
Three different approaches will be utilized to predict the global CO2 emissions and temperature in the next 10 years:
- Holt exponential smoothing: By applying this approach, consequently each relevant variables’ (e.g. gas fuel, liquid fuel and solid fuel) future value will be obtained. And we can use them to predict the future CO2 emission by employing the linear regression model.
- SARIMA: Seasonal Autoregressive Integrated Moving Average (SARIMA) model, an extension of ARIMA that explicitly supports univariate time series data with a seasonal component will be applied to conduct the prediction. We can use it gain the annual CO2 emission in the future with a lower and upper bound.
- Auto-Regression: The Auto-Regression model describes the relationship between current values and the historical values. And it uses the historical time data as the variable to predict its future value. The factors that influence the CO2 emission, such as solid fuel and gas fuel, can be predicted by Auto-Regression model. As a result, the future global CO2 emission will be predicted by employing the linear regression model.
After completing all prediction methods mentioned above, we intend to compare their result respectively with the actual CO2 emission in recent years as an evaluation and determine which of them is the best fit one.
