Group11 proposal
Contents
Background
Google Analytics is a suite of analytical tools to provide insights on website access to aid businesses decisions. It allows businesses to profile their website visitors and how they interact with the content. It provides Analytics Intelligence for quick answers to common metrics, numerous online reports on audience, advertising, acquisition, behaviour, conversion and user flow, and data analysis with data filtering, manipulation, segmentation and visualization features. A paid version "Google Analytics 360" provides more advanced eCommerce features on which users are likely to convert to customers and how best to use the marketing dollars.
Motivation
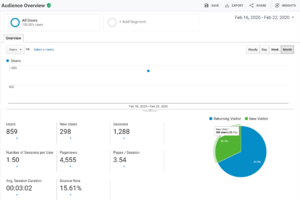
Google Analytics delivers a ton of insights into the users visiting the website. However, the visualizations are limited to line charts, bar charts, pie charts, highlight tables and geo maps. Also, besides the use of totals, averages and proportions, there is no available statistical analysis and inference of the data. One possible reason for such approach could be due to the mass target audience nature of the tool, as it could be difficult to make advanced visualizations and statistical analysis easily understood by the common users.
The third motivation stamps from the fact that Google Analytics is a hugely popular tool with good data management capabilities. This allows future analysis of the data outside the platform and in a repeatable manner that may have widespread benefits.


