Group04 Report
CHINA HAPPINESS SURVEY
|
|
|
|
|
|
Contents
Abstract
Happiness is a very important topic all around the world nowadays, especially in China, the country which is becoming more and more focus on people’s happiness because of the development. Happiness can be influenced by a lot of factors, such as health, education and income. Also, happiness can show different features in different regions. Our objective is to get the most important factors to happiness in China. Therefore, we will use several types of graphs such as likert scale, bubble plot and mapping to analyze the result of a survey on Chinese people’s happiness in 2015 and consider different provinces in China.
Project Motivation
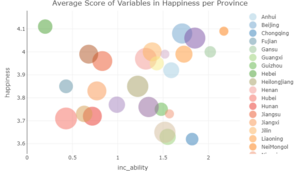
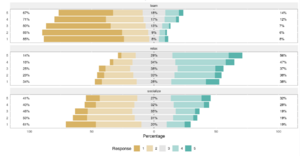
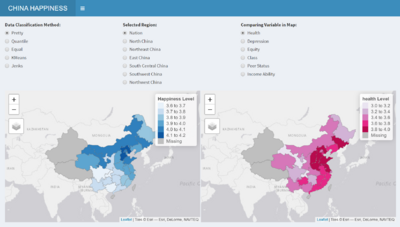
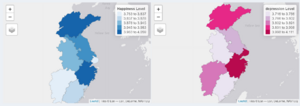
Our objective is to see the influence of different factors on happiness and get the most important factors. In order to get the factors, we will use several types of graphs, including exploratory data analysis, multivariate matrix analysis, likert scale, bubble plot, choropleth mapping and cluster analysis to analyze the happiness survey result in China in 2015 and show the results by different provinces. We will consider the happiness score given by the respondents themselves as the main target and choose several factors which we think have large influence on happiness to see the importance of them. Besides, when choosing the question results which can represent factors, we will choose subjective questions first, because they can directly show the real feelings of people.
R Packages Used
- For Interactive Application: R Shiny and Shiny Dashboard
Shiny is an R Studio package for developing interactive charts, data visualizations and applications to be hosted on the web using the R programming language. It enables developer to make an interactive application which allow user to understand a certain model or do some data explorations. In this case, we could visualize the underlying rules beyond given datasets which show a clear picture of how those items correlate with each other. Package ‘shiny’Package ‘shinydashboard’
- For Interactive Plot: ggplot2, plotly and gghighlight Package ‘plotly’ Package ‘ggplot2’ Package ‘gghighlight’
- For Choropleth Mapping: tmap, sf and leaflet Package ‘tmap’Package ‘leaflet’
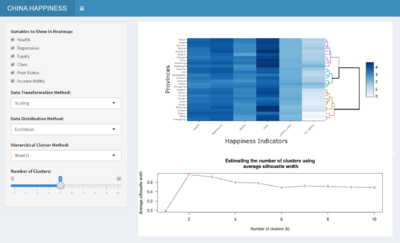
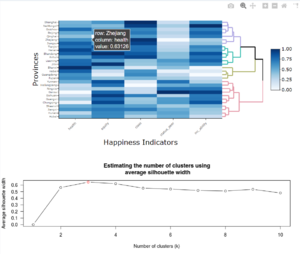
- For HeatMap: heatmaply Package ‘heatmaply’
- For Likert Scale: likert Package ‘likert’
- For Correlation Matrix: corrplot Package ‘corrplot’
- For data preparation: sqldf(for SQL operations in R),dplyr,stringr Package ‘sqldf’ Package ‘dplyr’ Package ‘stringr’
Data Cleaning and Preparation
Our data come from the result of <Chinese General Social Survey 2015 Annually Survey> done by Renmin University of China, which is basically about people’s life. It has a large number of questions about nearly all fields. Because there are too many questions and results, we only choose the ones we need to analyze. Except for the basic results such as the number of respondents, their gender and age, and the happiness scores, for the happiness factors, we mainly focus on health, depression, equity, class, peer status, income, relaxing, socializing and learning. All of them have subjective questions which can show people’s real status and logic scores. Pay attention, in the survey, the higher the scores of peer status and income ability are, the worse the situation is. In addition, Xinjiang, Xizang and Hainan does not have any data, so we will not consider them when making graphs.
| Data field | Original questionnaire number | Question | Remarks |
|---|---|---|---|
| id | - | ID | - |
| province | s41 | Survey Location - Province/Autonomous Region/Municipality | 1 = Shanghai; 2 = Yunnan Province; 3 = Inner Mongolia Autonomous Region; 4 = Beijing; 5 = Jilin Province; 6 = Sichuan Province; 7 = Tianjin; 8 = Ningxia Hui Autonomous Region; 9 = Anhui Province; 10 = Shandong Province ; 11 = Shanxi Province; 12 = Guangdong Province; 13 = Guangxi Zhuang Autonomous Region; 14 = Xinjiang Uygur Autonomous Region; 15 = Jiangsu Province; 16 = Jiangxi Province; 17 = Hebei Province; 18 = Henan Province; 19 = Zhejiang Province; 20 = Hainan Province; 21 = Hubei Province; 22 = Hunan Province; 23 = Gansu Province; 24 = Fujian Province; 25 = Tibet Autonomous Region; 26 = Guizhou Province; 27 = Liaoning Province; 28 = Chongqing City; 29 = Shaanxi Province; 30 = Qinghai Province; 31 = Heilongjiang Province; |
| gender | a2 | Gender | 1 = Male; 2 = Female |
| birth | a301 | Birthday | - |
| health | a15 | Do you feel your current physical health | 1 = Unhealthy; 2 = Less healthy; 3 = Fair; 4 = healthy; 5 = Very Healthy; |
| depression | a17 | How often you feel depressed or depressed in the past four weeks | 1 = Always; 2 = Often; 3 = Sometimes; 4 = Rarely; 5 = Never; |
| socialize | a311 | In the past year, do you often do the following in your free time-social | 1 = Never; 2 = Rarely; 3 = Sometimes; 4 = Often; 5 = Always; |
| relax | a312 | In the past year, do you often do the following in your free time-relax | 1 = Never; 2 = Rarely; 3 = Sometimes; 4 = Often; 5 = Always; |
| learn | a313 | In the past year, do you often do the following in your free time-study | 1 = Never; 2 = Rarely; 3 = Sometimes; 4 = Often; 5 = Always; |
| equity | a35 | Generally speaking, do you think society is unfair today? | 1 = Completely unfair; 2 = More unfair; 3 = Not fair but not unfair; 4 = More fair; 5 = Completely fair; |
| happiness | a36 | Overall, do you think your life is happy | 1 = Very unhappy; 2 = Relatively unhappy; 3 = Not happy or unhappy; 4 = Relatively happy; 5 = Very happy; |
| class | a431 | At what level do you think you are currently | 1 = 1(bottom); 10 = 10(top); |
| status_peer | b1 | What is your socioeconomic status compared to your peers | 1 = Higher; 2 = Almost; 3 = Lower; |
| inc_ability | b5 | Considering your ability and working conditions, is your current income reasonable? | 1 = Very reasonable; 2 = Reasonable; 3 = Unreasonable; 4 = Very unreasonable; |
Choice of Visualizations and Critics
Application Design in Details
Use Cases
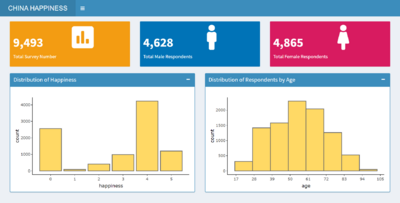
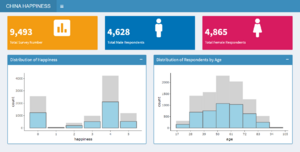
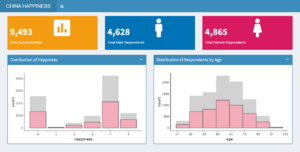
1.Bashboard
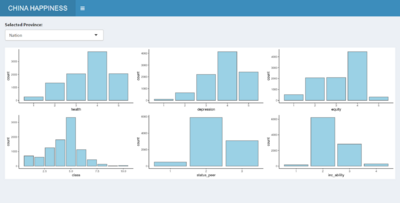
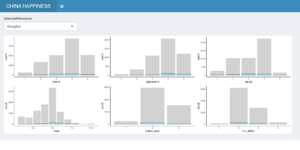
2.Exploratory Data Analysis
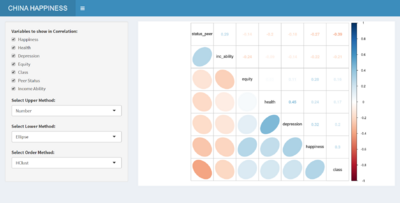
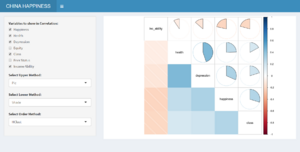
3.Multivariate Matrix Analysis
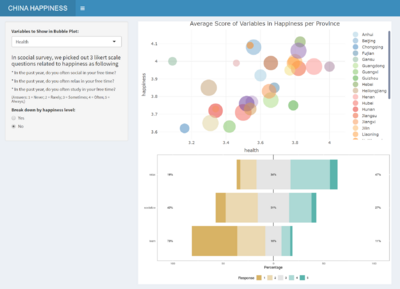
4.Likert & Bubble Plot
5.Choropleth Mapping
6.Cluster Analysis
References
- World Happiness Report 2020
- Shiny Application layout guide,JJ Allaire
- Event handler R Shiny
- Build your first web app dashboard using Shiny and R
- Enterprise-ready dashboards
- ggplot2 Reference and Examples (Part 2) - Colours
- Hands-On Exercise 8: Diverging Stacked Bar Chart, Dr. Kam Tin Seong
- Hands-on Exercise 8: Heatmap Visualisation with R, Dr. Kam Tin Seong
- Hands-On Exercise 8: Visualising Correlation Matrix, Dr. Kam Tin Seong
- Hands-on Exercise 10: Choropleth Mapping with R, Dr. Kam Tin Seong
- Hands-on Exercise 10: Mapping Geospatial Point Data with R, Dr. Kam Tin Seong

