Group05 proposal
|
|
|
|
|
|
Contents
Introduction
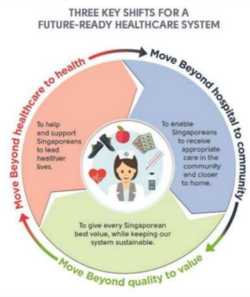
The Ministry of Health (MOH) believes in ensuring quality and affordable basic medical services for all. Singapore’s healthcare system is designed to ensure that everyone has access to different levels of healthcare in a timely, cost-effective and seamless manner.
Despite the efforts mentioned above, there are growing signs of unequal wealth distribution in Singapore. Our project seeks to test out whether the same availability to healthcare is provided to all planning areas in Singapore despite this phenomenon. This inquiry is supported by various data visualization and statistical techniques to arrive at a conclusion.
Background
Overview of Singapore's Healthcare Landscape
Singapore is one of the most developed state in Asia and the world (as measured by GDP per capita). Its healthcare spending per capita is one of the highest in Asia and the world, which means that the majority of the population is likely to enjoy good quality healthcare. This can be largely attributed to the core philosophy of the MOH's beliefs in ensuring quality and affordable basic medical services to all.
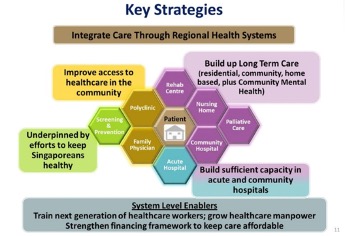
Singapore’s healthcare system is designed to ensure that everyone has access to different levels of healthcare in a timely, cost-effective and seamless manner. The key policies enabling this includes:
- Improving access to healthcare in the community: Increase acute beds by 1,700 and community hospital beds to 3,000 by 2020, Investment in primary care infrastructure (polyclinics, community health centres)
- Enhancing key enablers including technology and manpower: Adding 30,000 more healthcare workers by 2020 and adopting digital technologies such as AI
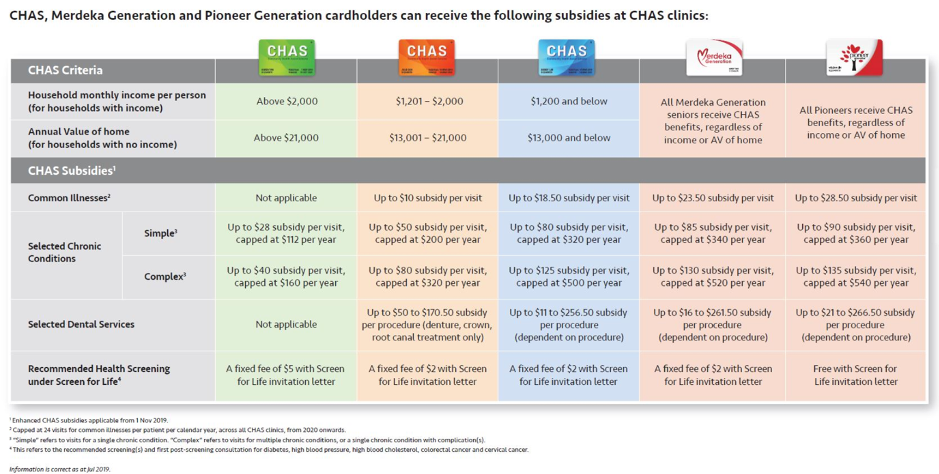
- Strong financing policies to ensure healthcare costs remain affordable to the masses. This includes policy packages like the Pioneer Generation Package (subsidies for elderly medical care), MediShield Life (universal insurance coverage) and the Community Health Assistance Scheme (means-tested subsidies on primary care).
Motivation
Despite these efforts, there are growing signs of unequal wealth distribution in Singapore. We intend to test out whether healthcare availability is provided equitably to all planning areas in Singapore despite differences in income levels (per planning are) and also whether there is appropriate healthcare coverage for the ageing population.
Objective
To assess the status of Singapore’s availability to healthcare based whether the existing healthcare facilities and social support meets the demands of the poorer income groups and ageing population. Based on the results, we hope to conclude that either (a): There is no significant difference in accessibility despite geographical differences in income and age groups across the island or (b): there is significant difference in accessibility correlating to geographical differences in income and age groups across the island.
Visual Data Exploratory
- Develop a visual layout of Singapore’s wealth distribution (monthly household income) on a geospatial basis
- Layer on age distribution across the planning areas
- Develop a visual layout of Singapore’s healthcare network (primary, tertiary, community, aged homes) on a geospatial basis
- Explore mapping over elderly friendly zones / wheelchair friendly zones that allow elderly access to nearest healthcare facilities
- Explore availability of further social support including but not limited to Family Service Centres, Resident Centres.
- To highlight primary care facilities with lower income social support such as CHAS, PG etc.
Interactive Visualisation Result
From policymaker point of view:
- oversight of healthcare and social support demand vs. healthcare supply and facilities
- able to pinpoint locations whereby there may be healthcare availability gaps
From everyday Singaporean point of view:
- overview of all healthcare facilities providing all levels of care
- able to toggle to the nearest healthcare facility
- able to view the social support provided in the planning area
Literature Review
| Index | Topic |
|---|---|
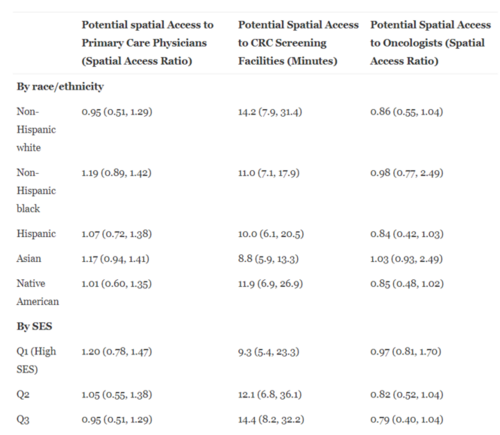
| Methods to measure spatial access to health services | According to Wan et al (2012), access to medical services refers to a person’s ease of obtaining health-care services that can bring about the best possible health outcome. Access can be classified into spatial and non-spatial access, for which examples of spatial access are like location and travel distance while non-spatial ones are like socio-economic status (SES), health insurance and cultural background.
The paper goes on to describes a series of methods that have been developed to measure spatial access, including but not limited to the regional availability method, kernel density models and gravity-based models. The paper critiques a drawback of the enhanced 2-step floating catchment area (E2SFCA) method and suggests that the spatial access ratio (SPAR) method was more effective. The paper concludes that the SPAR method, a relative spatial access assessment approach, was more stable to the variation of distance impedance as compared to previous methods and hence a more robust method to measure spatial access to health services. Our team will take into consideration these various spatial methods developed to construct/inform/reference our own spatial access index. |
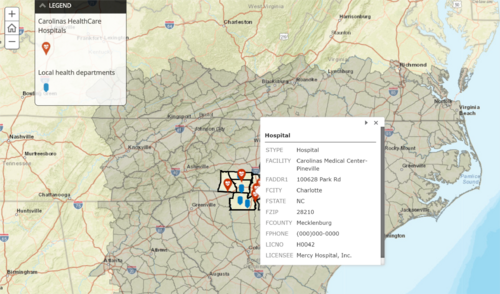
| Geo-spatial interactive map | The North Carolina Institute for Public Health (NCIPH) developed a geo-spatial interactive map on the Carolinas Healthcare System. The tool assesses 12 Social Determinants of Health (SDOH) indicators at the neighborhood-level within their 10-county service region. The tool will enable policy-makers and healthcare administrators better understand the factors determining healthcare quality in the relevant planning regions. We will review the tool to adapt relevant features into our own geo-spatial tool. |
Tools & Package Used
| S.No. | Packages | Purpose |
|---|---|---|
| 1 | Shiny | For creating R shiny interfaces |
| 2 | Tidyverse | Collection of R packages for data analysis, packages includes ggplot2, dplyr, tidyr, readr, purrr, tibble, stringr, forcats |
| 3 | Httr | For working with HTTP |
| 4 | Leaflet | For creating interactive maps |
| S.No. | Packages | Purpose |
|---|---|---|
| 1 | Selenium | Web-based automation tool which can be used for crawling data |
Datasets Used
- List of clinics & hospitals: http://hcidirectory.sg/hcidirectory/clinic.do?task=load
- List of CHAS approved clinics: https://www.chas.sg/clinic_locator.aspx?id=90
- Resident Households by Planning Area and Monthly Household Income from Work: https://www.singstat.gov.sg/find-data/search-by-theme/population/geographic-distribution/latest-data > General Household survey > Resident Households > T152
- Singapore Residents by Planning Area, Subzone, Age, Gender & Type of dwelling: https://www.singstat.gov.sg/find-data/search-by-theme/population/geographic-distribution/latest-data > Population Trends > Singapore Residents by Planning AreaSubzone, Age Group, Sex and Type of Dwelling, June 2011-2019
Reference
- The UK Healthcare system: http://assets.ce.columbia.edu/pdf/actu/actu-uk.pdf
- The Hidden Costs of a Successful Developmental State: Prosperity and Paucity in Singapore: http://www.lse.ac.uk/international-development/Assets/Documents/PDFs/Dissertation/Prizewinning-Dissertations/PWD-2017/2018-ACY.pdf
- Overview of the Health System and Regulatory Landscape in Singapore, 24th EPSO Conference26 September 2017, Adj Assoc Prof (Dr) Raymond ChuaGroup Director (Health Regulation Group), Ministry of Health
- https://www.aic.sg/care-services/Community%20Health%20Centres
- https://sph.unc.edu/nciph/gis/
- https://www.mdpi.com/1660-4601/16/2/170
- https://www.mdmag.com/medical-news/us-ranks-29th-in-global-healthcare-access-and-quality-index
- N.Wan, F. Benjamin Zhan, B.Zou and Edwin Chow (2012), A relative spatial access assessment approach for analyzing potential spatial access to colorectal cancer services in Texas. Applied Geography, Volume 32, Issue 2, March 2012, pp 291-299.
- https://sph.unc.edu/nciph/gis/

