Group06 proposal
ATMs by Spar Nord in Denmark
Contents
Overview
Spar Nord is a bank based in Denmark. It has over 100 ATMs located around the nation to serve their customers for cash withdrawal within Denmark. With banks transforming digital, there is increasing people using cards and mobile payments, and the demand for cash is decreased. As reported by Mckinsey, in Denmark where electronic instruments have driven cash usage below 40 percent, banks are facing a constant challenge to reduce the fixed cost of ATM networks and the high manual cost of cash in operations, distribution, maintenance, and processing.
In this project, we will use data visualization techniques to map out the ATMs location, volume of transactions, frequency of transactions. We will apply several data analysis techniques to analyze the utility of the ATMs.
Scope
The project scope is limited to cash withdrawals made from ATMs of Spar Nord in 2017. We will be supplementing the data with other relevant information, such as geographical data, strategic location descriptions of the ATM, population density, etc.
Approach
The app aims to provide bank policymakers to understand how their ATMs are used, hence providing supporting evidence for their decisions towards their goals of reducing operation cost.
Time- Series analysis for the demand for cash
We will use time-series analysis to find out the transaction patterns of each ATM. The ATMs will be clustered based on their time-series analysis.
Geospatial analysis for location of ATM
We will use the ATM location information provided, to map out to the city map.
The app should also be able to:
- Show transactions trend of each ATM.
- Estimate the time periods for ATM to have a high number of transactions.
- Identify the ATMs with low utility, such as low transactions at a unit time.
- Estimate the high and low periods for use of the ATM.
- Estimate the demand of cash for different currencies. Ie, the demand for DKK and EUR are different.
- Show locations of the ATMs.
- Show a map of the nearby ATM and analyse if the location of the ATM is in high-footfall areas, such as shopping malls, airports, trade centres, etc.
- Identify the areas with more ATMs are placed than demanded.
We have a few additional features enabled for the user:
- To show the transactions by card types used for withdrawal and percentage and volume card issued by Spar Nord.
- Show the failure rate of the ATM and identify if the failure is due to insufficient cash loaded or other network issues.
Outcome
Where the visualization could have useful practical implications to inform decision-makers on policy-making decisions in order to:
- Visualizing the demand of cash for different currencies in different areas
- Visualizing the Spar Nord card usage rate in different areas.
- Visualizing the error rate and error type of different ATM machines and their manufacturer.
- Visualizing transaction peak time and peak location
- Clustering ATMs according to their peak transaction time among a week. Link location of these clusters to the actual area planning, for example, CBD or Residential area.
- Optimize ATM locations to reduce maintenance costs. Reduce the number of ATMs in areas with low transaction frequency.
Data Source
We will primarily use open-source data from Spar Nord. The dataset contains information about the location of the Spar Nord’s ATM, manufacturer, currency, card type, weather conditions, etc.
ATM Information
Details of ATM, including ATM ID, the manufacturer of the ATM and the status of ATM, which indicates whether the ATM is still in service or has been closed permanently.
ATM Service
This dataset only contains transaction records for withdrawal. Details of the transaction including card type, currency, error message code, and text. Error message code and text occurred only when the error happened during the transaction.
Bus Route
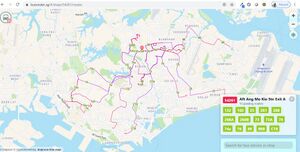
Returns detailed route information for all services currently in operation, including: all bus stops along each route, first/last bus timings for each stop.
Withdrawal Date and Time
Date and time the withdrawal was made in 2017, detailed up to hour.
ATM Locations
Spatio information for each ATM machine, including street name and number, zip code, latitude, and longitude.
Weather
The weather during each transaction, including temperature, pressure, humidity, wind speed, rain volume, etc.
Visualization Feature
Methodology
This project aims to help Spar Nord to understand their ATMs business better, hence improve the customer's experience and to develop operating efficiency. There are 4 main phases included in the methodology of the project, explorational phase, analysis phase, optimation phase, and implementation.
- Data Extraction - Requesting for access to data from LTA and building API interface to extract data
- Preliminary study - Reading up on existing work done on Singapore bus transportation network and understand transportation engineering models
- First phase analysis and visualization - Building of high level visualizations to clearly show status quo and areas for improvement
- Second phase analysis and visualization - Deep dive into issues and identify solutions
- Implementation - Build R-Shiny app and report
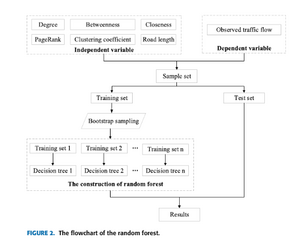
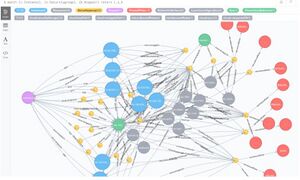
Solution may include graphical analysis, geospatial analysis in the realm of transport engineering such as Gravity Model(Multiple Regression Model), Network analysis, modelling Centrality.

Limitations
- Due to data limitations and security, the withdrawn amount and operating cost information were not included in the dataset, our analysis only depends on the using frequency and error rate.
- As our project is limited in the data of Spad Nord, our analysis will only be based on the business status of Spad Nord.
Team Members
- Ren Siqi
- Wei Yuqi
- Liu Xinran
Tools and Packages
Reference
- Bilir, Canser. (2018). OPTIMIZATION OF ATM AND BRANCH CASH OPERATIONS USING AN INTEGRATED CASH REQUIREMENT FORECASTING AND CASH OPTIMIZATION MODEL. Business & Management Studies: An International Journal. 6. 10.15295/v6i1.219.
- Denstad A, Ulsund E, Christiansen M, et al. Multi-objective optimization for a strategic ATM network redesign problem[J]. Annals of Operations Research, 2019: 1-27.
- Optimizing the ATM Network With Analytics
- The science behind banks’ ATM location strategy
- Attacking the cost of cash
- TSrepr use case - Clustering time series representations in R
- How to use hierarchical cluster analysis on time series data
- Annual Year Report from Spar Nord
- Interactive Web Maps with R- published by R Studio

