Difference between revisions of "Group09 proposal"
Yjlee.2019 (talk | contribs) |
Yjlee.2019 (talk | contribs) |
||
| Line 4: | Line 4: | ||
CHNS(China Health and Nutrition Survey) offer good resource for us to explore the income inequility problem in China,with more than 10 years data.Beyond original work scope,we will involve updated survey data to show the result.Besides,China context-income inequility gap among regions,will also be taken into consideration when conducting the analysis.The final result will be presented in a interactive visualization view.<br> | CHNS(China Health and Nutrition Survey) offer good resource for us to explore the income inequility problem in China,with more than 10 years data.Beyond original work scope,we will involve updated survey data to show the result.Besides,China context-income inequility gap among regions,will also be taken into consideration when conducting the analysis.The final result will be presented in a interactive visualization view.<br> | ||
| − | |||
| − | |||
== Data Source == | == Data Source == | ||
| Line 140: | Line 138: | ||
== References == | == References == | ||
| + | * [https://doi.org/10.1093/geronb/gbr050 Does Self-reported Health Bias the Measurement of Health Inequalities in U.S. Adults? Evidence Using Anchoring Vignettes From the Health and Retirement Study.] | ||
Revision as of 22:35, 29 February 2020
Contents
Abstract
Income equility is a hot issue these years,many sub-topics have been derived from this theme.Scholars have studied about the rootcause that result in this situation,the post-impact of income inequility and so on.Our project is to explore the relationship between individual income inequility and health.It will be a extension study of a existing work,published by Bakkeli, N., Income inequality and health in China: A panel data analysis.
CHNS(China Health and Nutrition Survey) offer good resource for us to explore the income inequility problem in China,with more than 10 years data.Beyond original work scope,we will involve updated survey data to show the result.Besides,China context-income inequility gap among regions,will also be taken into consideration when conducting the analysis.The final result will be presented in a interactive visualization view.
Data Source
This data from the ' China Health and Nutrition Survey '. Click here to see the data.
About Data Set
The survey took place over a 7-day period using a multistage, random cluster process to draw a sample of about 7,200 households with over 30,000 individuals in 15 provinces and municipal cities that vary substantially in geography, economic development, public resources, and health indicators. In addition, detailed community data were collected in surveys of food markets, health facilities, family planning officials, and other social services and community leaders.
Variables
(Dependent variable) Health
(Independent variable) Income inequality, Income Variables, Individual controls, Occupation and Sector
The table below shows the description of main variables that we will be using for our analysis:
| Variable | Description |
|---|---|
| Health | |
| Blood pressure | Binary variable. Defined as 0 if the blood pressure of object within normal range, else 1. A normal blood pressure is defined as at or below 120/80 mmHg. |
| WHR | The waist-hip ratio. Binary variable. Defined as 1 if the ratio above limit, else 0. A normal WHR is defined as at or below 0.80 for women and 0.90 for men. |
| MAMC | Mid-arm muscle circumference. Binary variable. Defined as 1 if this figure is abnormal and 0 otherwise. individuals with 20.88 or more for women and 22.77 or more for men are coded normal. |
| Overweightness | Binary variable. Defined as 1 if respondent is overweight, else 0. Non-overweight population in China is defined as below a BMI of 25 kg/m2. |
| Income inequality | |
| Gini | The Gini-coefficient in the county level, sensitive to changes at middle income levels. |
| Theil L | The mean logarithm deviation of the Generalized Entropy (Theil) indices, which is sensitive to changes at the bottom income levels. |
| Theil T | The Theil index and is sensitive to changes in upper income levels. |
| Theil V | The half the squared coefficient of variation of Theil index. |
| Income variables | |
| Individual income | The sum of each individual's income source, by adding up all individual income and revenue, minus individual expenditures. Household subsidies and other income that cannot be allocated to individuals in the household are not considered as a part of individual income. |
| County mean income(ind.) | Captures the degree of economic development in a county-level unit, calculated by averaging individual income in a county/city for all observations in the CHNS. “Ind” refer to individual. |
| Household income | The sum of all individual incomes in a household. |
| County mean income(hh.) | Calculated by averaging household income in a county/city for all observation in the CHNS. “hh” refer to household. |
| Individual controls | |
| Age | The age of respondent. |
| Gender | Binary variable. Defined male as 0 and female as 1. |
| Married | Binary variable. Married as 1, unmarried as 0. |
| Majority | If the nationality of object is Han, then defined as “1”, else 0. |
| Years of education | Calculated from the beginning of primary school, 6 years of primary school graduation, 9 years of junior high school graduation, 12 years of high school graduation, and 16 years of university graduation. |
| urban | Binary variable. If respondent holds urban household registration then defined as 1, else 0. |
| Occupation | |
| Services class | Includes “senior professional/technical”, “administrator/executive/manager” and “army officer/police officer”. |
| Non-manual worker | Includes “junior professional technical” and “office staff”. |
| Skilled worker/supervisor | Includes “skilled worker” and “ordinary soldier, policeman”, “driver” and “athlete, actor, musician”. |
| Semi-/non-skilled worker | Includes “non-skilled worker” and “service worker”. |
| Farmer | As originally defined by CHNS data. |
| Others | The rest of original occupation covered by CHNS data. |
| Sector | |
| State | Includes “government”, “state service/institute” and “state-owned enterprise”. |
| Collective | Includes “small collective enterprise” and “large collective enterprise”. |
| Family farming | As original variable “family contract farming” of CHNS data. |
| Individual enterprise | As variable “private, individual enterprise”, which originally defined by CHNS |
| Private three-cap Enterpr. | The same as “three- capital enterprise” in CHNS data. |
| Others | Includes “unknown” data in CHNS. |
Visualization
Exploratory Data Analysis
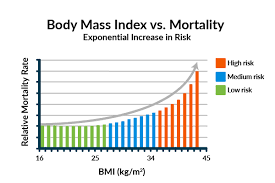
EDA is a common approach to summarize main characteristics of data, often with visual methods. In the first part of our dashboard, we use chats to tell the reason why we want to test the relationship between economic development and health risks in China, and to tell information about the data used in this project beyond the formal modeling or hypothesis testing task.
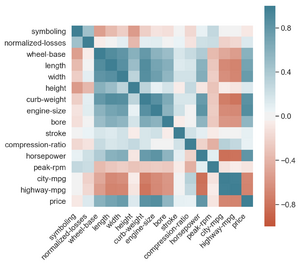
After using Linear Probability Model to examine the relation between Health Risks and Economic Development, we use Correlation Matrix Plots to show the result of our final hypothesis.
Methodology
We aim to provide an interactive dashboard that help to visualise descriptive and predictive statistics models for the relationship between Health Risks and Economic Development in China. This helps users clarify the effectiveness of different economy indexes on Rural vs Urban, Male vs Female health condition. This web app can then be deployed and used by others to help them explore data intelligently and help understand the relationship between the above variables.
Hypothesis
We hypothesize that greater economic development increases health risks. There are enough evidences to support that developing of Chinese economy brings great pressure which increases the rate of unhealthy behaviours such as smoking and alcohol abuse, and notably high occurrences of chronic diseases such as hypertension, heart disease, and diabetes. Therefore, nationals have higher health risks.
Model
Linear Probability Model (LPM) is a popular model used in social sciences research and we use it to examine our hypothesis, is there any relationship between Health Risks and Economy Developments in China. LPM is a regression model where the target or dependent variable is a binary variable and the independent variables can be binary and continuous. In our project, we use equation similar to following one to test hypothesis.
Sensitivity Test
After using LPM on our hypothesis, we need to finish robustness to test model stability. We use two ways. First is that we replace our original economy index with the other one and see is there any difference on results. Second, we use household based index rather than individual base index and see the results.
Critics of Existing Works
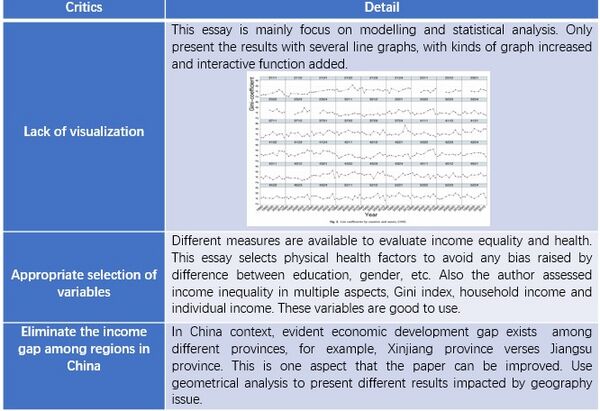
Our project is an extension of this research published by Bakkeli in 2016.Table below shows a summary about this work.
Bakkeli, N. (2016). Income inequality and health in China: A panel data analysis.Social Science & Medicine, 157, 39–47.
| Critics | Detail |
|---|---|
| Lack of visualization | This essay is mainly focus on modelling and statistical analysis. Only present the results with several line graphs, with kinds of graph increased and interactive function added. |
| Appropriate selection of variables | Appropriate selection of variables
Different measures are available to evaluate income equality and health. This essay selects physical health factors to avoid any bias raised by difference between education, gender, etc. Also the author assessed income inequality in multiple aspects, Gini index, household income and individual income. These variables are good to use. |
| Eliminate the income gap among regions in China | In China context, evident economic development gap exists among different provinces, for example, Xinjiang province verses Jiangsu province. This is one aspect that the paper can be improved. Use geometrical analysis to present different results impacted by geography issue. |


