Difference between revisions of "Group11 proposal"
Junyili.2018 (talk | contribs) |
Junyili.2018 (talk | contribs) |
||
| Line 35: | Line 35: | ||
The recent availability of this dataset provides us with an opportunity to work on information that is current. This dataset also combines geospatial data with aspatial information that allows us to apply geospatial regression techniques and geospatial clustering to understand nutrition and health outcomes (diabetes and obesity). | The recent availability of this dataset provides us with an opportunity to work on information that is current. This dataset also combines geospatial data with aspatial information that allows us to apply geospatial regression techniques and geospatial clustering to understand nutrition and health outcomes (diabetes and obesity). | ||
| − | Despite the importance of studying food consumption at scale, there is little data about what people actually eat over long periods of time. Our analysis will link these food consumption data of an area in Greater London through both aspatial and geospatial methods. | + | Despite the importance of studying food consumption at scale, there is little data about what people actually eat over long periods of time. Our analysis will link these food consumption data of an area in Greater London through both aspatial and geospatial methods. We will attempt to analyze the eating habits of Londoners based on this dataset through a non-biased, non-personalized lens that is prevalent in current web data from social media and geo-referenced media. |
== Project Objectives == | == Project Objectives == | ||
Revision as of 12:13, 23 April 2020
Contents
Background
Grocery data from in-store purchases of 411 Tesco shops in the Greater London area are used in this R Shiny application. In this project, we will focus on using the nutrients information from this dataset at 4 different spatial granularities, Lower Super Output Areas (LSOA), Middle Layer Super Output Areas (MSOA), ward and Local Authority Districts (LAD).
The analysis is performed, notably through four sections:
- Exploratory Data Analysis (EDA)
- Exploratory Spatial Data Analysis (ESDA)
- Clustering (Hierarchical, GeoSpatial, Skater Clustering)
- Geographically weighted regression (GWR)
Motivation
The recent availability of this dataset provides us with an opportunity to work on information that is current. This dataset also combines geospatial data with aspatial information that allows us to apply geospatial regression techniques and geospatial clustering to understand nutrition and health outcomes (diabetes and obesity).
Despite the importance of studying food consumption at scale, there is little data about what people actually eat over long periods of time. Our analysis will link these food consumption data of an area in Greater London through both aspatial and geospatial methods. We will attempt to analyze the eating habits of Londoners based on this dataset through a non-biased, non-personalized lens that is prevalent in current web data from social media and geo-referenced media.
Project Objectives
The project aims to deliver a R-Shiny app that provides:
- Interactive user interface design
- Visualization of nutritional information through aspatial and geospatial methods
- Geographically
- reproducible workflow for the export and import of Google Analytics data.
Proposed Scope and Methodology
- Analysis of Google Analytics schema to understand the data structure, metadata and table relationships
- Analysis of Google Analytics data management features to support export of data
- Analysis of R data management features and packages to support import of data
- Sourcing of sample data for analysis and testing
- Analysis of existing Google Analytics features and shortfalls for enhancements
- Design of enhanced UI, visualizations, statistical analysis and workflow
- R-Shiny app development and testing
- Demonstration of R-Shiny app
- Pilot run with live data
Storyboard & Visualization Features
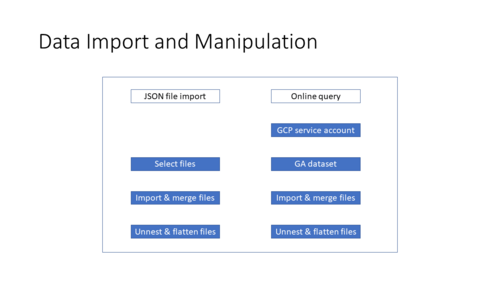
- Data Import and Manipulation
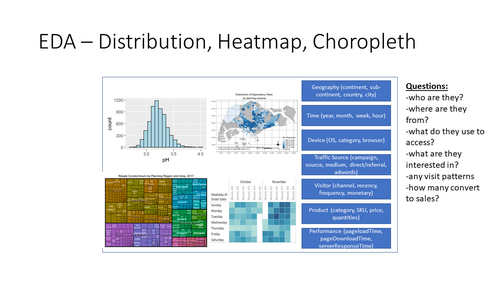
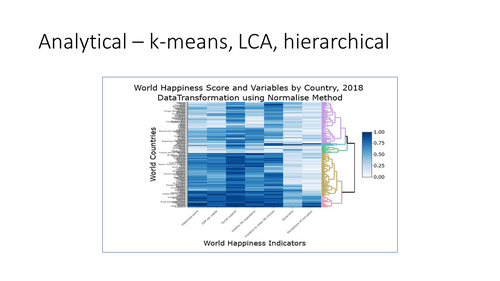
- EDA – Distribution, Heatmap, Choropleth
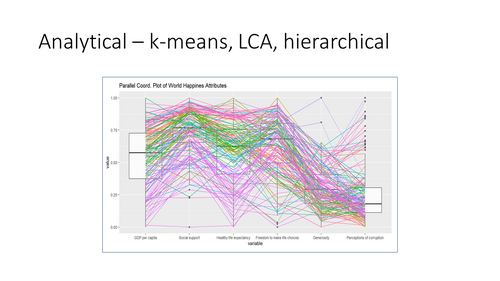
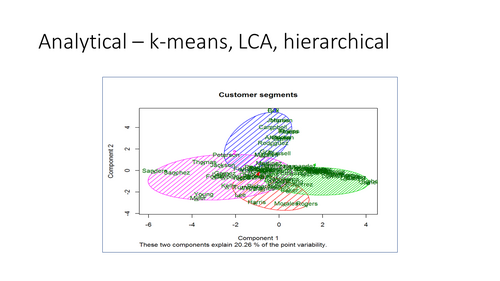
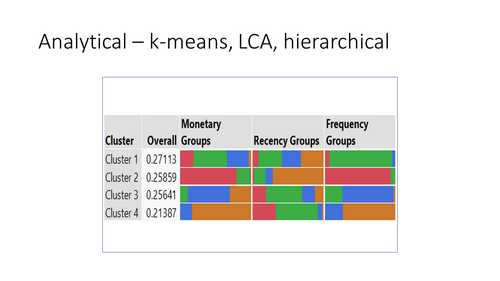
- Analytical – k-means, LCA, hierarchical clustering
Data Source & Preparation
In January 2018, Google BigQuery published a Google Analytics sample with twelve months (Aug 2016 to Aug 2017) of obfuscated Google Analytics 360 data on the Google Merchandise Store, a real ecommerce store that sells Google-branded merchandise. The data is typical of what an ecommerce website would see and includes the following information:
- Traffic source data: information about where website visitors originate, including data about organic traffic, paid search traffic, and display traffic
- Content data: information about the behaviour of users on the site, such as URLs of pages that visitors look at, how they interact with content, etc.
- Transactional data: information about the transactions on the Google Merchandise Store website.
However, data for some fields is obfuscated, such as fullVisitorId, or removed such as clientId, adWordsClickInfo and geoNetwork. “Not available in demo dataset” will be returned for STRING values and “null” will be returned for INTEGER values when querying the fields containing no data.
The is a huge dataset of 400+ variables with a daily data incremental rate of approximately 25MB for 1,500 sessions and 40,000 detailed records. It can be exported to AVRO, JSON or CSV formats.
- Google Analytics Sample
- BigQuery Export schema
- Google Analytics Dimensions & Metrics Explorer
- Google Official Merchandise Store
Software Tools
- RStudio: https://rstudio.com/
R Packages
- rjson: https://cran.r-project.org/web/packages/rjson
- jsonlite: https://cran.r-project.org/web/packages/jsonlite
- bigrquery: https://cran.r-project.org/web/packages/bigrquery
- shiny: https://shiny.rstudio.com
- shinydashboard: https://cran.r-project.org/web/packages/shinydashboard
- ggplot2: https://cran.r-project.org/web/packages/ggplot2
- plotly: https://plot.ly/r
- poLCA: https://cran.r-project.org/web/packages/poLCA
- tidyverse: https://www.tidyverse.org
- trelliscope: https://www.rdocumentation.org/packages/trelliscope/versions/0.9.7
- ClustGeo: https://cran.r-project.org/web/packages/ClustGeo
- spdep: https://cran.r-project.org/web/packages/spdep
- GWmodel: https://cran.r-project.org/web/packages/GWmodel
- spgwr: https://cran.r-project.org/web/packages/spgwr
- geofacet: https://cran.r-project.org/web/packages/geofacet
Team Members
- LI Junyi Darren
- Muhammad Jufri Bin RAMLI
- TEO Lip Peng Raymond
References
- Tesco Grocery 1.0, a large-scale dataset of grocery purchases in London
- Tesco Grocery 1.0 dataset
- Metadata record for: Tesco Grocery 1.0
- Large-scale and high-resolution analysis of food purchases and health outcomes
- Guide to presenting statistics for Super Output Areas (June 2018)
- Data on child obesity and excess weight at small area level
- How Geographically Weighted Regression (GWR) works
- Wikipedia: Greater London
- RGN boundaries 2019 BGC
- LAD boundaries 2019 BGC
- Wards boundaries 2019 BGC
- MSOA boundaries 2011 BGC
- LSOA boundaries 2011 BGC

