Difference between revisions of "Group11 proposal"
m (→References) |
m (→References) |
||
| Line 118: | Line 118: | ||
*[http://geoportal.statistics.gov.uk/datasets/826dc85fb600440889480f4d9dbb1a24_0 MSOA SHP] | *[http://geoportal.statistics.gov.uk/datasets/826dc85fb600440889480f4d9dbb1a24_0 MSOA SHP] | ||
*[https://geoportal.statistics.gov.uk/datasets/lower-layer-super-output-areas-december-2011-boundaries-ew-bfc LSOA SHP] | *[https://geoportal.statistics.gov.uk/datasets/lower-layer-super-output-areas-december-2011-boundaries-ew-bfc LSOA SHP] | ||
| + | *[https://webarchive.nationalarchives.gov.uk/20170110165409/https://www.noo.org.uk/visualisation Data on child obesity and excess weight at small area level] | ||
Revision as of 18:18, 12 April 2020
Contents
Background
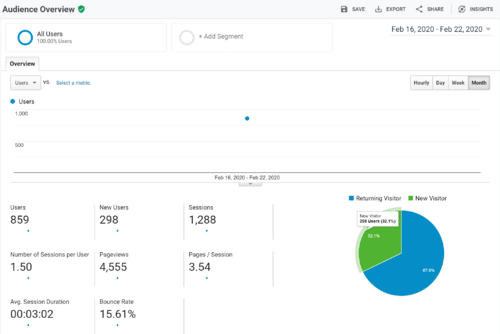
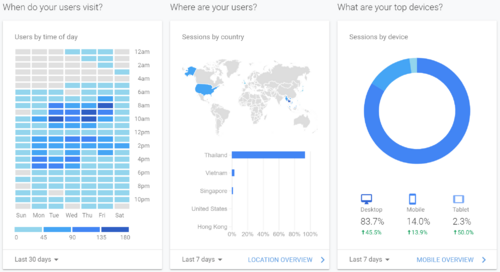
Google Analytics is a suite of analytical tools to provide insights on website access to aid businesses decisions. It allows businesses to profile their website visitors and how they interact with the content. It provides Analytics Intelligence for quick answers to common metrics, numerous online reports on audience, advertising, acquisition, behaviour, conversion and user flow, and data analysis with data filtering, manipulation, segmentation and visualization features. A paid version "Google Analytics 360" provides more advanced eCommerce features on which users are likely to convert to customers and how best to use the marketing dollars.
Motivation
Google Analytics delivers a ton of insights into the users visiting the website. However, the visualizations are limited to line charts, bar charts, pie charts, highlight tables and geo maps. Also, besides the use of totals, averages and proportions, there is no available statistical analysis and inference of the data. One possible reason for such approach could be due to the mass target audience nature of the tool, as it could be difficult to make advanced visualizations and statistical analysis easily understood by the common users.
The third motivation stamps from the fact that Google Analytics is a hugely popular tool with good data management capabilities. This allows further analysis and visualization of the data outside the platform and in a repeatable manner that may have practical benefits.
Project Objectives
The project aims to deliver a R-Shiny app that provides:
- better interactivity in user interface design;
- visualization of key audience, behaviour and performance insights;
- statistical analysis and inferences on key audience, behaviour and performance data; and
- reproducible workflow for the export and import of Google Analytics data.
Proposed Scope and Methodology
- Analysis of Google Analytics schema to understand the data structure, metadata and table relationships
- Analysis of Google Analytics data management features to support export of data
- Analysis of R data management features and packages to support import of data
- Sourcing of sample data for analysis and testing
- Analysis of existing Google Analytics features and shortfalls for enhancements
- Design of enhanced UI, visualizations, statistical analysis and workflow
- R-Shiny app development and testing
- Demonstration of R-Shiny app
- Pilot run with live data
Storyboard & Visualization Features
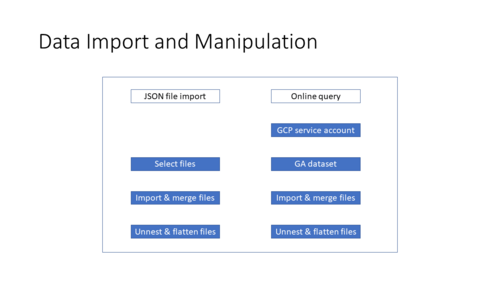
- Data Import and Manipulation
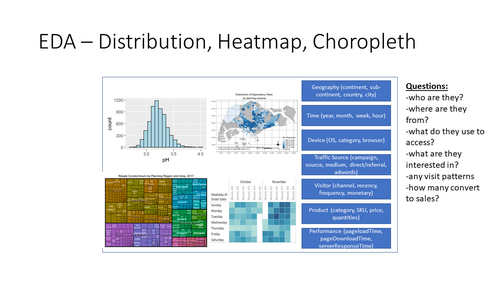
- EDA – Distribution, Heatmap, Choropleth
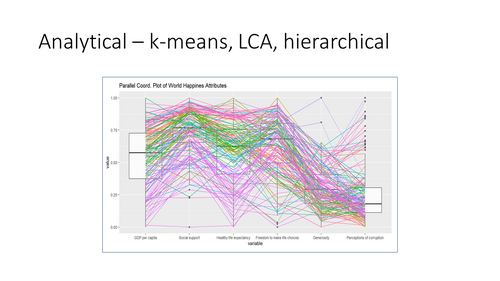
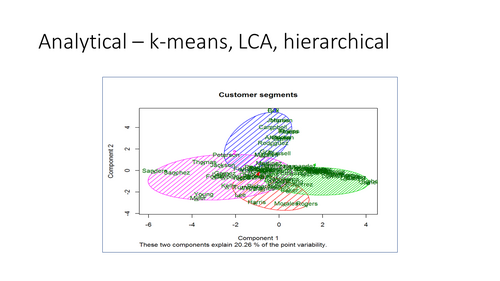
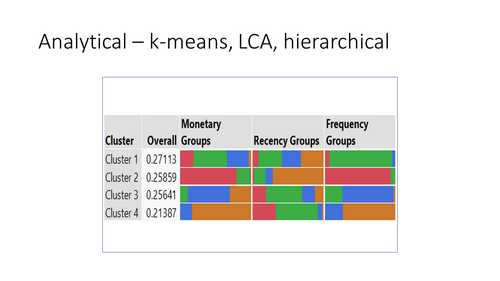
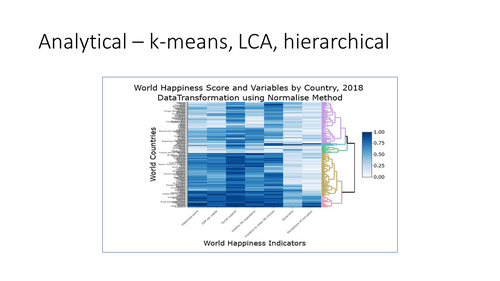
- Analytical – k-means, LCA, hierarchical clustering
Data Source & Preparation
In January 2018, Google BigQuery published a Google Analytics sample with twelve months (Aug 2016 to Aug 2017) of obfuscated Google Analytics 360 data on the Google Merchandise Store, a real ecommerce store that sells Google-branded merchandise. The data is typical of what an ecommerce website would see and includes the following information:
- Traffic source data: information about where website visitors originate, including data about organic traffic, paid search traffic, and display traffic
- Content data: information about the behaviour of users on the site, such as URLs of pages that visitors look at, how they interact with content, etc.
- Transactional data: information about the transactions on the Google Merchandise Store website.
However, data for some fields is obfuscated, such as fullVisitorId, or removed such as clientId, adWordsClickInfo and geoNetwork. “Not available in demo dataset” will be returned for STRING values and “null” will be returned for INTEGER values when querying the fields containing no data.
The is a huge dataset of 400+ variables with a daily data incremental rate of approximately 25MB for 1,500 sessions and 40,000 detailed records. It can be exported to AVRO, JSON or CSV formats.
- Google Analytics Sample
- BigQuery Export schema
- Google Analytics Dimensions & Metrics Explorer
- Google Official Merchandise Store
Software Tools
- RStudio: https://rstudio.com/
R Packages
- rjson: https://cran.r-project.org/web/packages/rjson
- jsonlite: https://cran.r-project.org/web/packages/jsonlite
- bigrquery: https://cran.r-project.org/web/packages/bigrquery
- shiny: https://shiny.rstudio.com
- shinydashboard: https://cran.r-project.org/web/packages/shinydashboard
- ggplot2: https://cran.r-project.org/web/packages/ggplot2
- plotly: https://plot.ly/r
- poLCA: https://cran.r-project.org/web/packages/poLCA
- tidyverse: https://www.tidyverse.org
- trelliscope: https://www.rdocumentation.org/packages/trelliscope/versions/0.9.7
- ClustGeo: https://cran.r-project.org/web/packages/ClustGeo
- spdep: https://cran.r-project.org/web/packages/spdep
- GWmodel: https://cran.r-project.org/web/packages/GWmodel
- spgwr: https://cran.r-project.org/web/packages/spgwr
- geofacet: https://cran.r-project.org/web/packages/geofacet
Team Members
- LI Junyi Darren
- Muhammad Jufri Bin RAMLI
- TEO Lip Peng Raymond
References
- The Ultimate Guide to Google Analytics in 2020
- Working with JSON data in very simple way
- Wikipedia: Greater London
- Tesco Grocery 1.0, a large-scale dataset of grocery purchases in London
- Tesco Grocery 1.0 dataset
- Metadata record for: Tesco Grocery 1.0
- Large-scale and high-resolution analysis of food purchases and health outcomes
- Statistical GIS Boundary Files for London
- Guide to presenting statistics for Super Output Areas (June 2018)
- Wards SHP
- MSOA SHP
- LSOA SHP
- Data on child obesity and excess weight at small area level

