Difference between revisions of "Group02 proposal"
Jump to navigation
Jump to search
| Line 76: | Line 76: | ||
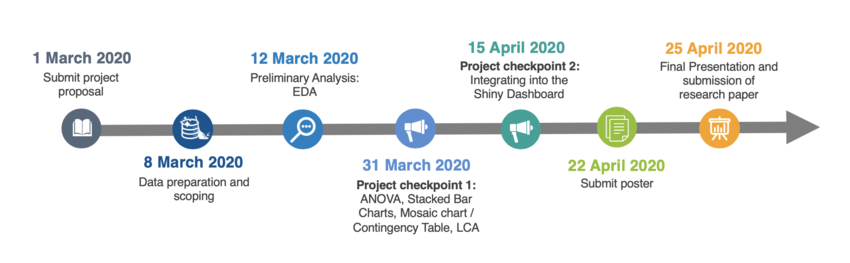
==Project Milestones== | ==Project Milestones== | ||
| − | [[File:Group 02 timeline.png| | + | [[File:Group 02 timeline.png|850px|frameless|center]] |
==Team Members== | ==Team Members== | ||
Revision as of 13:04, 1 March 2020

This is an awesome title
This is an awesome subtitle
Contents
Introduction
Motivation and Objectives
Literature Review
Datasource / Data Description
Visual Analytics Problem/Critique of Existing Visualisations
Methodologies and Approach
Proposed R Packages
| Package Name | Description |
|---|---|
| shiny & shiny dashboard | Interactive web applications for data visualization |
| ggplot2 | High-quality graphs |
| Tidyverse: tidyr, dplyr, ggplot2 | Tidying and manipulating data for visualizing in ggplot2 |
| shinythemes | Apply themes to Shiny applications |
| ggthemr | Apply themes to ggplot2 plots |
| lubridate | Easily transform dates |
| Plotly | Provide graphics |
| ggraph | Provide graphics for clustering, regression |
| ggiraph | Provide interactive ggplot graphics |
| k Means Algorithms in R | Provide various k means algorithms in R |
| ISLR | Provide glm() for logistic regression |
Project Milestones
