Difference between revisions of "Group05 proposal"
| (63 intermediate revisions by 3 users not shown) | |||
| Line 1: | Line 1: | ||
| − | <div style=background:# | + | <div style=background:#D3D3D3 border:#A3BFB1> |
| − | + | [[File:Banner.png|750px|frameless|center]] | |
| − | [[File: | + | </div> |
| − | |||
<!--MAIN HEADER --> | <!--MAIN HEADER --> | ||
| − | {|style="background-color:# | + | {|style="background-color:#A9A9A9;" width="100%" cellspacing="0" cellpadding="0" valign="top" border="0" | |
| − | | style="font-family: | + | | style="font-family: Helvetica; font-size:100%; solid #000000; background:#000000; text-align:center;" width="20%"| |
; | ; | ||
| − | [[ | + | [[Group05_proposal|<b><font size="2"><font color="#FFFAF0">Project Proposal</font></font></b>]] |
| − | | style="font-family: | + | | style="font-family: Helvetica; font-size:100%; solid #000000; background:#A9A9A9; text-align:center;" width="20%" | |
; | ; | ||
| − | [[ | + | [[Group05_poster|<b><font size="2"><font color="#FFFAF0">Poster</font></font></b>]] |
| − | | style="font-family: | + | | style="font-family: Helvetica; font-size:100%; solid #1B338F; background:#A9A9A9; text-align:center;" width="20%" | |
; | ; | ||
| − | [[ | + | [[Group05_application|<b><font size="2"><font color="#FFFAF0">Application</font></font></b>]] |
| − | | style="font-family: | + | | style="font-family: Helvetica; font-size:100%; solid #1B338F; background:#A9A9A9; text-align:center;" width="20%" | |
; | ; | ||
| − | [[ | + | [[Group05_user_guide|<b><font size="2"><font color="#FFFAF0">User Guide</font></font></b>]] |
| − | | style="font-family: | + | | style="font-family: Helvetica; font-size:100%; solid #1B338F; background:#A9A9A9; text-align:center;" width="20%" | |
; | ; | ||
| − | [[ | + | [[Group05_research_paper| <b><font size="2"><font color="#FFFAF0">Practice Research Paper</font></font></b>]] |
| | | | ||
|} | |} | ||
<br/> | <br/> | ||
| − | |||
| − | |||
| − | + | ==Introduction== | |
| + | Singapore has experienced significant economic growth since its independence, however, there are growing signs of social inequality and deterioration of societal well-being. Singapore’s ageing population resulting in a decreasing economic dependency ratio has placed a significant burden on the healthcare system. '''Our project aims to develop a data-driven decision support tool for policy-makers and analysts to explore relationships pertaining to healthcare equity and availability in Singapore.''' This includes a geo-spatial break-down of Singapore's income, demographic and healthcare availability indices to draw associative relationships as well as a postal-code based dynamic tool that fetches information on the nearest healthcare facilities. This aims to enable policy-makers to answer questions pertaining to the demand-supply dynamics of meeting healthcare needs and pinpoint locations where infrastructural gaps may exist. | ||
==Background== | ==Background== | ||
| − | ===Singapore's Healthcare | + | ===Overview of Singapore's Healthcare Landscape=== |
| − | Singapore is one of the most developed state (measured by GDP per capita) | + | Singapore is one of the most developed state in Asia and the world (as measured by GDP per capita). Its healthcare spending per capita is one of the highest in Asia and the world, which means that the majority of the population is likely to enjoy good quality healthcare. |
| + | |||
| + | The Ministry of Health (MOH) aims to ensure quality and affordable basic medical services for all Singaporeans, such that all aspects of the population have access to these services in a timely, cost-effective and seamless manner. Singapore's healthcare system comprises of two key pillars: the physical networks of primary, intermediate and long-term care (ILTC) services and a means-tested financing framework commonly referred to as the "subsidies + 3M" framework. | ||
[[File: MOH 3 Beyonds.png|250px]] | [[File: MOH 3 Beyonds.png|250px]] | ||
| − | Singapore’s | + | Singapore’s healthcare system is designed to ensure that everyone has access to different levels of healthcare in a timely, cost-effective and seamless manner. The key policies enabling this includes: |
# Improving access to healthcare in the community: Increase acute beds by 1,700 and community hospital beds to 3,000 by 2020, Investment in primary care infrastructure (polyclinics, community health centres) | # Improving access to healthcare in the community: Increase acute beds by 1,700 and community hospital beds to 3,000 by 2020, Investment in primary care infrastructure (polyclinics, community health centres) | ||
# Enhancing key enablers including technology and manpower: Adding 30,000 more healthcare workers by 2020 and adopting digital technologies such as AI | # Enhancing key enablers including technology and manpower: Adding 30,000 more healthcare workers by 2020 and adopting digital technologies such as AI | ||
# Strong financing policies to ensure healthcare costs remain affordable to the masses. This includes policy packages like the Pioneer Generation Package (subsidies for elderly medical care), MediShield Life (universal insurance coverage) and the Community Health Assistance Scheme (means-tested subsidies on primary care). | # Strong financing policies to ensure healthcare costs remain affordable to the masses. This includes policy packages like the Pioneer Generation Package (subsidies for elderly medical care), MediShield Life (universal insurance coverage) and the Community Health Assistance Scheme (means-tested subsidies on primary care). | ||
| − | [[File:Key strategies.jpg|500px]] | + | [[File:Key strategies.jpg|300px]] |
| + | |||
| + | ===Motivation=== | ||
| + | Whilst Singapore has one of the best healthcare system in the world (ranked #6 globally by the WHO), it scores highly on efficiency but not so on availability and equity. This is exacerbated by the increased strain on the capacity of the systems by aforementioned challenges, which points to an important aspect of well-being that needs to be critically examined. Using R Studio’s Shiny App as the basis of our interactive framework, we develop a series of dataviz tools to enable the user to explore the central theme of healthcare equity and availability in Singapore and its dynamic relationship with other economic and demographic measures. | ||
| + | |||
| + | Our research and development efforts were motivated by the lack of an interactive public healthcare tool that integrates GIS information to encourage greater research and discussions in the public domain on the prevailing healthcare system. Existing works have often focused on a static analysis of healthcare financing, delivery and economic growth at the national level and few have sliced the national pie into its constituent planning areas for a deeper analysis. Therefore, our tool aims to bridge this analytical gap by: | ||
| + | * Displaying a cartographical breakdown of healthcare network (primary, tertiary, nursing homes) on an internet map like Openstreetmap; | ||
| + | * Layer on relevant demographic data like age and income distributions to facilitate policy planning; | ||
| + | * Create a user-centric tool to display closest healthcare facilities within a 2km radius; and | ||
| + | * Determine associative relationships between the healthcare network and socio-economic indices like income inequality etc. | ||
| + | |||
| + | ==Methodology and Proposed Storyboard== | ||
| + | ===Objective=== | ||
| + | Develop a dynamic user-friendly policy-centric tool for policy-makers, analysts and the research community to interactively explore geospatial relationships between key economic (income), healthcare availability and demographic data. This allows policy-makers to determine whether existing and future healthcare infrastructural plans are sufficiently to meet supply-demand dynamics posed by an evolving demographics base across the island. | ||
| + | |||
| + | ===Storyboard=== | ||
| + | In order to draw conclusive relationships between healthcare, demographic and economic indicators, we propose to develop four policy-centric tabs in Shiny R to visualize these relationships: | ||
| + | |||
| + | {| class="wikitable" | ||
| + | |- | ||
| + | ! Proposed Layout !! Storyboard | ||
| + | |- | ||
| + | |[[File:Tab one.png|frameless|500px|left]] || | ||
| + | '''Tab 1: Interactive maps on nearest clinic facilities:''' | ||
| + | |||
| + | The first tab acts as a pathfinder to navigate the extensive network of clinic services in Singapore, the interactive map (Figure 1) allows users to input a specific zip code to display the nearest healthcare facilities within a 2km radius. Users will be able to navigate the distance slider to decide the exact radius. The data table below the map will also change accordingly, sorting the healthcare facilities from nearest to furthest. | ||
| + | |- | ||
| + | |[[File:Tab two2.png|500px|frameless|left]] || | ||
| + | '''Tab 2: Visualization of healthcare availability:''' | ||
| + | |||
| + | The second tab provide a dynamic framework to allow users to view various healthcare availability indicators per 10’000 population; users are able to slice the data in young, active and old segments to draw meaningful conclusions on these population groups. To modify the map gradient, users may manipulate the data classification methods to suit their preferences in segregating the various planning areas and sub-zones. We also use linear regression models to observe if there was a relationship between population and the various healthcare facilities with the former being the independent variable and the latter being the dependent variable. | ||
| + | |- | ||
| + | |[[File:Tab three.png|frameless|500px|left]]|| | ||
| + | '''Tab 3: Statistical association of income distribution indices:''' | ||
| + | |||
| + | We provide users the option to choose between faceted and stacked bar charts to visualize income distribution per planning area with different data classification methods (quartile, quintile and decile). Users are able to multi-select planning areas to compare. We use a ranking chart to sort the planning areas according to its Gini coefficient to visualize income inequality. | ||
| + | |- | ||
| + | |[[File:Tab four.png|500px|frameless|left]]|| | ||
| + | '''Tab 4: Association between income inequality and healthcare availability indices:''' | ||
| + | |||
| + | In the final tab, healthcare equity comparison, we compare income inequality, Gini coefficient, with the various healthcare availability indicators. Users have the option to view these measures by total or old population. The planning areas that appear towards the bottom right indicate higher income inequality (higher Gini coefficient) but lower healthcare availability while the planning areas that appear towards the top left indicates lower income inequality but higher healthcare availability. The gap between such extremes indicate the positive association between areas with high income inequality and low healthcare availability measures. | ||
| + | |} | ||
| + | ==Literature Review== | ||
| − | = | + | {| class="wikitable" |
| − | + | |- | |
| + | ! Index !! Topic | ||
| + | |- | ||
| + | | Incorporation of geographic information systems (GIS) into healthcare studies || The Singhealth-IHiS system enables healthcare institutions to undertake evaluation and analytical studies with geo-spatial analytics embedded. However, this is only accessible by relevant public health institutions and not to the general public. Hence, hitherto, there is no similar geo-spatial tool available in the public research domain. | ||
| + | |- | ||
| + | | Methods to measure spatial access to health services|| According to Wan et al (2012), access to medical services refers to a person’s ease of obtaining health-care services that can bring about the best possible health outcome. Access can be classified into spatial and non-spatial access, for which examples of spatial access are like location and travel distance while non-spatial ones are like socio-economic status (SES), health insurance and cultural background. | ||
| − | + | The paper goes on to describes a series of methods that have been developed to measure spatial access, including but not limited to the regional availability method, kernel density models and gravity-based models. The paper critiques a drawback of the enhanced 2-step floating catchment area (E2SFCA) method and suggests that the spatial access ratio (SPAR) method was more effective. | |
| − | |||
| − | + | [[File:Image 720.png|350px]] | |
| − | |||
| − | |||
| − | |||
| − | |||
| − | |||
| − | |||
| − | [[File: | + | The paper concludes that the SPAR method, a relative spatial access assessment approach, was more stable to the variation of distance impedance as compared to previous methods and hence a more robust method to measure spatial access to health services. Our team will take into consideration these various spatial methods developed to construct/inform/reference our own spatial access index. |
| + | |- | ||
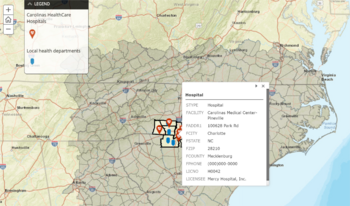
| + | | Geo-spatial interactive map || The North Carolina Institute for Public Health (NCIPH) developed a geo-spatial interactive map on the Carolinas Healthcare System. The tool assesses 12 Social Determinants of Health (SDOH) indicators at the neighborhood-level within their 10-county service region. The tool will enable policy-makers and healthcare administrators better understand the factors determining healthcare quality in the relevant planning regions. We will review the tool to adapt relevant features into our own geo-spatial tool. | ||
| + | [[File:123.png|350px]] | ||
| + | |} | ||
| + | ==Tools & Package Used== | ||
| − | + | [https://rstudio.com/ Rstudio] | |
| − | |||
| − | |||
| − | |||
| − | + | {| class="wikitable" | |
| − | + | |- | |
| − | + | ! S.No. !! Packages !! Purpose | |
| − | + | |- | |
| + | | 1 || [https://shiny.rstudio.com Shiny] || For creating R shiny interfaces | ||
| + | |- | ||
| + | | 2 || [https://www.tidyverse.org Tidyverse] || Collection of R packages for data analysis, packages includes [https://cran.r-project.org/web/packages/ggplot2/index.html ggplot2], [https://cran.r-project.org/web/packages/dplyr/index.html dplyr], [https://cran.r-project.org/web/packages/tidyr/index.html tidyr], [https://cran.r-project.org/web/packages/readr/index.html readr], [https://cran.r-project.org/web/packages/purrr/index.html purrr], [https://cran.r-project.org/web/packages/tibble/index.html tibble], [https://cran.r-project.org/web/packages/stringr/index.html stringr], [https://cran.r-project.org/web/packages/forcats/index.html forcats] | ||
| + | |- | ||
| + | | 3 || [https://cran.r-project.org/web/packages/httr/index.html Httr] || For working with HTTP | ||
| + | |- | ||
| + | | 4 || [https://rstudio.github.io/leaflet/ Leaflet] || For creating interactive maps | ||
| + | |- | ||
| + | | 5 || [https://cran.r-project.org/web/packages/PASWR/index.html PASWR] || Allows for statistical commands to be executed in R | ||
| + | |- | ||
| + | | 6 || [https://cran.r-project.org/web/packages/janitor/index.html Janitor] || Provides additional tools to examine and clean dirty data | ||
| + | |- | ||
| + | | 7 || [https://cran.r-project.org/web/packages/plotly/index.html Plotly] || Creates interactive web graphics | ||
| + | |- | ||
| + | | 8 || [https://cran.r-project.org/web/packages/sf/index.html Sf] || Provides a standardized way to encode spatial vector data | ||
| + | |- | ||
| + | | 9 || [https://cran.r-project.org/web/packages/tmap/index.html Tmap] || Thematic maps to visualize spatial data distribution including choropleths and bubble maps | ||
| + | |- | ||
| + | | 10 || [https://cran.r-project.org/web/packages/geojsonio/index.html Geojsonio] || Converts data from and to 'GeoJSON' or 'TopoJSON' | ||
| + | |- | ||
| + | | 11 || [https://cran.r-project.org/web/packages/rgdal/index.html Rgdal] || Provides bindings for the 'Geospatial' Data Abstraction Library | ||
| + | |- | ||
| + | | 12 || [https://cran.r-project.org/web/packages/reldist/index.html Reldist] || Relative distribution methods used to calculate Gini Coefficient | ||
| + | |- | ||
| + | | 13 || [https://cran.r-project.org/web/packages/viridis/index.html Viridis] || Default color maps from 'matplotlib', a popular plotting library from python | ||
| + | |- | ||
| + | | 14 || [https://cran.r-project.org/web/packages/shinyWidgets/index.html shinyWidgets] || Custom input widgets for Shiny App | ||
| + | |- | ||
| + | | 15 || [https://cran.r-project.org/web/packages/geosphere/index.html Geosphere] || The package implements spherical trigonometry functions for geographic applications. | ||
| + | |- | ||
| + | |} | ||
| + | |||
| + | [https://www.python.org/ Python] | ||
| + | |||
| + | {| class="wikitable" | ||
| + | |- | ||
| + | ! S.No. !! Packages !! Purpose | ||
| + | |- | ||
| + | | 1 || [https://selenium-python.readthedocs.io/ Selenium] || Web-based automation tool which can be used for crawling data | ||
| + | |- | ||
| + | |} | ||
==Datasets Used== | ==Datasets Used== | ||
| Line 78: | Line 161: | ||
* List of CHAS approved clinics: https://www.chas.sg/clinic_locator.aspx?id=90 | * List of CHAS approved clinics: https://www.chas.sg/clinic_locator.aspx?id=90 | ||
* Resident Households by Planning Area and Monthly Household Income from Work: https://www.singstat.gov.sg/find-data/search-by-theme/population/geographic-distribution/latest-data > General Household survey > Resident Households > T152 | * Resident Households by Planning Area and Monthly Household Income from Work: https://www.singstat.gov.sg/find-data/search-by-theme/population/geographic-distribution/latest-data > General Household survey > Resident Households > T152 | ||
| − | * | + | * Singapore Residents by Planning Area, Subzone, Age, Gender & Type of dwelling: https://www.singstat.gov.sg/find-data/search-by-theme/population/geographic-distribution/latest-data > Population Trends > Singapore Residents by Planning AreaSubzone, Age Group, Sex and Type of Dwelling, June 2011-2019 |
| + | * Masterplan 2014 Planning Area Boundary: https://data.gov.sg/dataset/master-plan-2014-planning-area-boundary-web | ||
| + | * Masterplan 2014 Subzone Boundary: https://data.gov.sg/dataset/master-plan-2014-subzone-boundary-web | ||
| + | |||
| + | ==Project Timeline== | ||
| + | [[File:Timeline.png|frameless|1000px]] | ||
| + | |||
| + | ==Team Members== | ||
| + | [[File:ava1.png|500px|frameless|align 4=left|Jiahao]] [[File:ava2.png|200px|frameless|align 4=center|Pei Zhi]] [[File:Ava3.png|500px|frameless|align 4=right|Andrew]] | ||
| + | [https://www.linkedin.com/in/jiahao-yee-5191a958/| <span style="color:#0000FF">'''Jiahao's Linkedin'''</span>] [https://www.linkedin.com/in/leepeizhi//| <span style="color:#0000FF">'''Pei Zhi's Linkedin'''</span>] Andrew.lim.2018@mitb.smu.edu.sg | ||
==Reference== | ==Reference== | ||
| + | * WB (World Bank), 1985. World Development Report 1985. New York: Oxford University Press. | ||
| + | * Low, D., and Gill, A., 2014. Healthcare Financing: How Should Costs Shift from Private Pockets to the Public Purse? Lee Kuan Yew School of Public Policy, National University of Singapore. | ||
| + | * Low, D. and Vadaketh, S. T., 2014. Hard Choices: Challenging the Singapore Consensus. NUS Press. | ||
| + | * Low LL, Tay WY, Ng JM, M., Tan SY, Liu N, Lee KH et al (2018). Frequent hospital admissions in Singapore: clinical risk factors and impact of socioeconomic status. Singapore Medical Journal. 2018; 59(1):39-43. | ||
| + | * Chew YQ, A., 2018. The Hidden Costs of a Successful Developmental State: Prosperity and Paucity in Singapore. London School of Economics. March 2018. | ||
| + | * Abeysinghe, Himani and Lim, 2011. Equity in Singapore’s Healthcare Financing, Challenges for the Singapore Economy after the Global Financial Crisis. Wilson P. Singapore: World Scientific. | ||
| + | * Smith, Catherine J.; Donaldson, John A.; Mudaliar, Sanushka; Md Kadir, Mumtaz; and Yeoh, Lam Keong. A handbook on inequality, poverty and unmet social needs in Singapore. (2015). Social Insight Research Series. 1-86. Lien Centre for Social Innovation: Research. | ||
| + | * Interactive geospatial map developed by the North Carolina Institute for Public Health (NCIPH), 2012. Accessible via https://sph.unc.edu/nciph/gis/ | ||
| + | *N.Wan, F. Benjamin Zhan, B.Zou and Edwin Chow (2012), A relative spatial access assessment approach for analyzing potential spatial access to colorectal cancer services in Texas. ''Applied Geography'', Volume 32, Issue 2, March 2012, pp 291-299. | ||
| + | * WHO (World Health Organization), 2010. Monitoring the Building Blocks of Health Systems: A Handbook of Indicators and their Measurement Strategies. | ||
| + | * Khalik, S. (2020, March 5). New hospital in the east; Alexandra to be expanded. Retrieved April 24, 2020, from https://www.straitstimes.com/singapore/new-hospital-in-the-east-alexandra-to-be-expanded | ||
| + | * Primary Healthcare Services. (n.d.). Retrieved from https://www.moh.gov.sg/home/our-healthcare-system/healthcare-services-and-facilities/primary-healthcare-services | ||
* The UK Healthcare system: http://assets.ce.columbia.edu/pdf/actu/actu-uk.pdf | * The UK Healthcare system: http://assets.ce.columbia.edu/pdf/actu/actu-uk.pdf | ||
| − | |||
* Overview of the Health System and Regulatory Landscape in Singapore, 24th EPSO Conference26 September 2017, Adj Assoc Prof (Dr) Raymond ChuaGroup Director (Health Regulation Group), Ministry of Health | * Overview of the Health System and Regulatory Landscape in Singapore, 24th EPSO Conference26 September 2017, Adj Assoc Prof (Dr) Raymond ChuaGroup Director (Health Regulation Group), Ministry of Health | ||
* https://www.aic.sg/care-services/Community%20Health%20Centres | * https://www.aic.sg/care-services/Community%20Health%20Centres | ||
| − | |||
* https://www.mdpi.com/1660-4601/16/2/170 | * https://www.mdpi.com/1660-4601/16/2/170 | ||
* https://www.mdmag.com/medical-news/us-ranks-29th-in-global-healthcare-access-and-quality-index | * https://www.mdmag.com/medical-news/us-ranks-29th-in-global-healthcare-access-and-quality-index | ||
Latest revision as of 19:57, 26 April 2020
|
|
|
|
|
|
Contents
Introduction
Singapore has experienced significant economic growth since its independence, however, there are growing signs of social inequality and deterioration of societal well-being. Singapore’s ageing population resulting in a decreasing economic dependency ratio has placed a significant burden on the healthcare system. Our project aims to develop a data-driven decision support tool for policy-makers and analysts to explore relationships pertaining to healthcare equity and availability in Singapore. This includes a geo-spatial break-down of Singapore's income, demographic and healthcare availability indices to draw associative relationships as well as a postal-code based dynamic tool that fetches information on the nearest healthcare facilities. This aims to enable policy-makers to answer questions pertaining to the demand-supply dynamics of meeting healthcare needs and pinpoint locations where infrastructural gaps may exist.
Background
Overview of Singapore's Healthcare Landscape
Singapore is one of the most developed state in Asia and the world (as measured by GDP per capita). Its healthcare spending per capita is one of the highest in Asia and the world, which means that the majority of the population is likely to enjoy good quality healthcare.
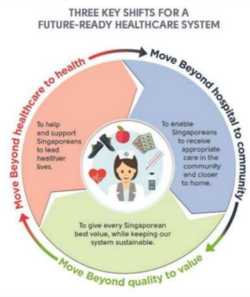
The Ministry of Health (MOH) aims to ensure quality and affordable basic medical services for all Singaporeans, such that all aspects of the population have access to these services in a timely, cost-effective and seamless manner. Singapore's healthcare system comprises of two key pillars: the physical networks of primary, intermediate and long-term care (ILTC) services and a means-tested financing framework commonly referred to as the "subsidies + 3M" framework.
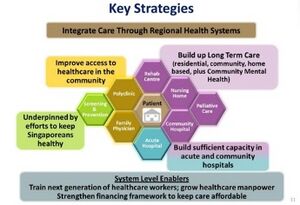
Singapore’s healthcare system is designed to ensure that everyone has access to different levels of healthcare in a timely, cost-effective and seamless manner. The key policies enabling this includes:
- Improving access to healthcare in the community: Increase acute beds by 1,700 and community hospital beds to 3,000 by 2020, Investment in primary care infrastructure (polyclinics, community health centres)
- Enhancing key enablers including technology and manpower: Adding 30,000 more healthcare workers by 2020 and adopting digital technologies such as AI
- Strong financing policies to ensure healthcare costs remain affordable to the masses. This includes policy packages like the Pioneer Generation Package (subsidies for elderly medical care), MediShield Life (universal insurance coverage) and the Community Health Assistance Scheme (means-tested subsidies on primary care).
Motivation
Whilst Singapore has one of the best healthcare system in the world (ranked #6 globally by the WHO), it scores highly on efficiency but not so on availability and equity. This is exacerbated by the increased strain on the capacity of the systems by aforementioned challenges, which points to an important aspect of well-being that needs to be critically examined. Using R Studio’s Shiny App as the basis of our interactive framework, we develop a series of dataviz tools to enable the user to explore the central theme of healthcare equity and availability in Singapore and its dynamic relationship with other economic and demographic measures.
Our research and development efforts were motivated by the lack of an interactive public healthcare tool that integrates GIS information to encourage greater research and discussions in the public domain on the prevailing healthcare system. Existing works have often focused on a static analysis of healthcare financing, delivery and economic growth at the national level and few have sliced the national pie into its constituent planning areas for a deeper analysis. Therefore, our tool aims to bridge this analytical gap by:
- Displaying a cartographical breakdown of healthcare network (primary, tertiary, nursing homes) on an internet map like Openstreetmap;
- Layer on relevant demographic data like age and income distributions to facilitate policy planning;
- Create a user-centric tool to display closest healthcare facilities within a 2km radius; and
- Determine associative relationships between the healthcare network and socio-economic indices like income inequality etc.
Methodology and Proposed Storyboard
Objective
Develop a dynamic user-friendly policy-centric tool for policy-makers, analysts and the research community to interactively explore geospatial relationships between key economic (income), healthcare availability and demographic data. This allows policy-makers to determine whether existing and future healthcare infrastructural plans are sufficiently to meet supply-demand dynamics posed by an evolving demographics base across the island.
Storyboard
In order to draw conclusive relationships between healthcare, demographic and economic indicators, we propose to develop four policy-centric tabs in Shiny R to visualize these relationships:
| Proposed Layout | Storyboard |
|---|---|
|
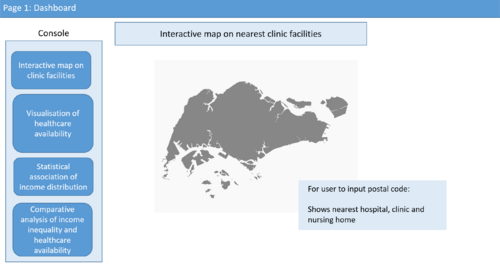
Tab 1: Interactive maps on nearest clinic facilities: The first tab acts as a pathfinder to navigate the extensive network of clinic services in Singapore, the interactive map (Figure 1) allows users to input a specific zip code to display the nearest healthcare facilities within a 2km radius. Users will be able to navigate the distance slider to decide the exact radius. The data table below the map will also change accordingly, sorting the healthcare facilities from nearest to furthest. | |
|
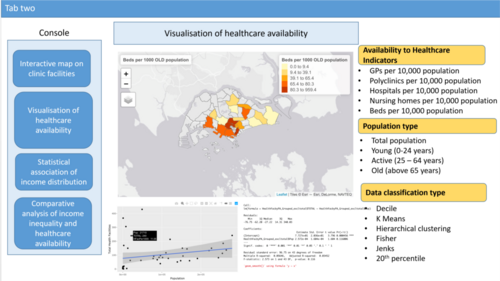
Tab 2: Visualization of healthcare availability: The second tab provide a dynamic framework to allow users to view various healthcare availability indicators per 10’000 population; users are able to slice the data in young, active and old segments to draw meaningful conclusions on these population groups. To modify the map gradient, users may manipulate the data classification methods to suit their preferences in segregating the various planning areas and sub-zones. We also use linear regression models to observe if there was a relationship between population and the various healthcare facilities with the former being the independent variable and the latter being the dependent variable. | |
|
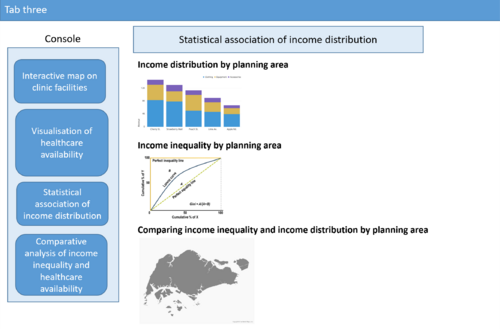
Tab 3: Statistical association of income distribution indices: We provide users the option to choose between faceted and stacked bar charts to visualize income distribution per planning area with different data classification methods (quartile, quintile and decile). Users are able to multi-select planning areas to compare. We use a ranking chart to sort the planning areas according to its Gini coefficient to visualize income inequality. | |
|
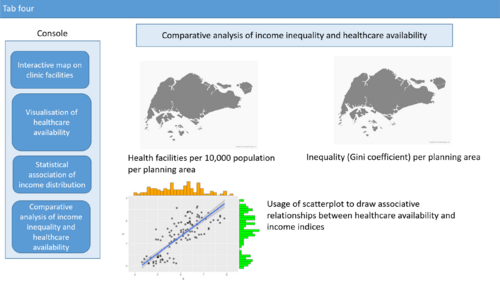
Tab 4: Association between income inequality and healthcare availability indices: In the final tab, healthcare equity comparison, we compare income inequality, Gini coefficient, with the various healthcare availability indicators. Users have the option to view these measures by total or old population. The planning areas that appear towards the bottom right indicate higher income inequality (higher Gini coefficient) but lower healthcare availability while the planning areas that appear towards the top left indicates lower income inequality but higher healthcare availability. The gap between such extremes indicate the positive association between areas with high income inequality and low healthcare availability measures. |
Literature Review
| Index | Topic |
|---|---|
| Incorporation of geographic information systems (GIS) into healthcare studies | The Singhealth-IHiS system enables healthcare institutions to undertake evaluation and analytical studies with geo-spatial analytics embedded. However, this is only accessible by relevant public health institutions and not to the general public. Hence, hitherto, there is no similar geo-spatial tool available in the public research domain. |
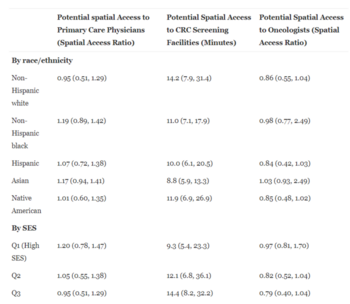
| Methods to measure spatial access to health services | According to Wan et al (2012), access to medical services refers to a person’s ease of obtaining health-care services that can bring about the best possible health outcome. Access can be classified into spatial and non-spatial access, for which examples of spatial access are like location and travel distance while non-spatial ones are like socio-economic status (SES), health insurance and cultural background.
The paper goes on to describes a series of methods that have been developed to measure spatial access, including but not limited to the regional availability method, kernel density models and gravity-based models. The paper critiques a drawback of the enhanced 2-step floating catchment area (E2SFCA) method and suggests that the spatial access ratio (SPAR) method was more effective. The paper concludes that the SPAR method, a relative spatial access assessment approach, was more stable to the variation of distance impedance as compared to previous methods and hence a more robust method to measure spatial access to health services. Our team will take into consideration these various spatial methods developed to construct/inform/reference our own spatial access index. |
| Geo-spatial interactive map | The North Carolina Institute for Public Health (NCIPH) developed a geo-spatial interactive map on the Carolinas Healthcare System. The tool assesses 12 Social Determinants of Health (SDOH) indicators at the neighborhood-level within their 10-county service region. The tool will enable policy-makers and healthcare administrators better understand the factors determining healthcare quality in the relevant planning regions. We will review the tool to adapt relevant features into our own geo-spatial tool. |
Tools & Package Used
| S.No. | Packages | Purpose |
|---|---|---|
| 1 | Shiny | For creating R shiny interfaces |
| 2 | Tidyverse | Collection of R packages for data analysis, packages includes ggplot2, dplyr, tidyr, readr, purrr, tibble, stringr, forcats |
| 3 | Httr | For working with HTTP |
| 4 | Leaflet | For creating interactive maps |
| 5 | PASWR | Allows for statistical commands to be executed in R |
| 6 | Janitor | Provides additional tools to examine and clean dirty data |
| 7 | Plotly | Creates interactive web graphics |
| 8 | Sf | Provides a standardized way to encode spatial vector data |
| 9 | Tmap | Thematic maps to visualize spatial data distribution including choropleths and bubble maps |
| 10 | Geojsonio | Converts data from and to 'GeoJSON' or 'TopoJSON' |
| 11 | Rgdal | Provides bindings for the 'Geospatial' Data Abstraction Library |
| 12 | Reldist | Relative distribution methods used to calculate Gini Coefficient |
| 13 | Viridis | Default color maps from 'matplotlib', a popular plotting library from python |
| 14 | shinyWidgets | Custom input widgets for Shiny App |
| 15 | Geosphere | The package implements spherical trigonometry functions for geographic applications. |
| S.No. | Packages | Purpose |
|---|---|---|
| 1 | Selenium | Web-based automation tool which can be used for crawling data |
Datasets Used
- List of clinics & hospitals: http://hcidirectory.sg/hcidirectory/clinic.do?task=load
- List of CHAS approved clinics: https://www.chas.sg/clinic_locator.aspx?id=90
- Resident Households by Planning Area and Monthly Household Income from Work: https://www.singstat.gov.sg/find-data/search-by-theme/population/geographic-distribution/latest-data > General Household survey > Resident Households > T152
- Singapore Residents by Planning Area, Subzone, Age, Gender & Type of dwelling: https://www.singstat.gov.sg/find-data/search-by-theme/population/geographic-distribution/latest-data > Population Trends > Singapore Residents by Planning AreaSubzone, Age Group, Sex and Type of Dwelling, June 2011-2019
- Masterplan 2014 Planning Area Boundary: https://data.gov.sg/dataset/master-plan-2014-planning-area-boundary-web
- Masterplan 2014 Subzone Boundary: https://data.gov.sg/dataset/master-plan-2014-subzone-boundary-web
Project Timeline
Team Members


Jiahao's Linkedin Pei Zhi's Linkedin Andrew.lim.2018@mitb.smu.edu.sg
Reference
- WB (World Bank), 1985. World Development Report 1985. New York: Oxford University Press.
- Low, D., and Gill, A., 2014. Healthcare Financing: How Should Costs Shift from Private Pockets to the Public Purse? Lee Kuan Yew School of Public Policy, National University of Singapore.
- Low, D. and Vadaketh, S. T., 2014. Hard Choices: Challenging the Singapore Consensus. NUS Press.
- Low LL, Tay WY, Ng JM, M., Tan SY, Liu N, Lee KH et al (2018). Frequent hospital admissions in Singapore: clinical risk factors and impact of socioeconomic status. Singapore Medical Journal. 2018; 59(1):39-43.
- Chew YQ, A., 2018. The Hidden Costs of a Successful Developmental State: Prosperity and Paucity in Singapore. London School of Economics. March 2018.
- Abeysinghe, Himani and Lim, 2011. Equity in Singapore’s Healthcare Financing, Challenges for the Singapore Economy after the Global Financial Crisis. Wilson P. Singapore: World Scientific.
- Smith, Catherine J.; Donaldson, John A.; Mudaliar, Sanushka; Md Kadir, Mumtaz; and Yeoh, Lam Keong. A handbook on inequality, poverty and unmet social needs in Singapore. (2015). Social Insight Research Series. 1-86. Lien Centre for Social Innovation: Research.
- Interactive geospatial map developed by the North Carolina Institute for Public Health (NCIPH), 2012. Accessible via https://sph.unc.edu/nciph/gis/
- N.Wan, F. Benjamin Zhan, B.Zou and Edwin Chow (2012), A relative spatial access assessment approach for analyzing potential spatial access to colorectal cancer services in Texas. Applied Geography, Volume 32, Issue 2, March 2012, pp 291-299.
- WHO (World Health Organization), 2010. Monitoring the Building Blocks of Health Systems: A Handbook of Indicators and their Measurement Strategies.
- Khalik, S. (2020, March 5). New hospital in the east; Alexandra to be expanded. Retrieved April 24, 2020, from https://www.straitstimes.com/singapore/new-hospital-in-the-east-alexandra-to-be-expanded
- Primary Healthcare Services. (n.d.). Retrieved from https://www.moh.gov.sg/home/our-healthcare-system/healthcare-services-and-facilities/primary-healthcare-services
- The UK Healthcare system: http://assets.ce.columbia.edu/pdf/actu/actu-uk.pdf
- Overview of the Health System and Regulatory Landscape in Singapore, 24th EPSO Conference26 September 2017, Adj Assoc Prof (Dr) Raymond ChuaGroup Director (Health Regulation Group), Ministry of Health
- https://www.aic.sg/care-services/Community%20Health%20Centres
- https://www.mdpi.com/1660-4601/16/2/170
- https://www.mdmag.com/medical-news/us-ranks-29th-in-global-healthcare-access-and-quality-index
