Difference between revisions of "Group08 proposal"
| (20 intermediate revisions by 2 users not shown) | |||
| Line 2: | Line 2: | ||
<!----------- Main Header ------------> | <!----------- Main Header ------------> | ||
| − | <div style= | + | <div style=background:#ffffff border:#A3BFB1> |
| − | + | [[File:Group_logo2.png|1000px|frameless|center]] | |
</div> | </div> | ||
| Line 10: | Line 10: | ||
| style="font-family:Segoe UI Semibold; font-size:100%; text-align:center;border-bottom:solid #176585" width="16.6%" | | | style="font-family:Segoe UI Semibold; font-size:100%; text-align:center;border-bottom:solid #176585" width="16.6%" | | ||
| − | [[ | + | [[Group08_proposal | <font size = 4; color="#176585">Proposal</font>]] |
| style="font-family:Segoe UI Light; font-size:100%; text-align:center;border-bottom:solid #BDD1DE" width="16.6%" | | | style="font-family:Segoe UI Light; font-size:100%; text-align:center;border-bottom:solid #BDD1DE" width="16.6%" | | ||
| − | [[ | + | [[Group08_poster | <font size = 4; color="#4180AB">Poster</font>]] |
| style="font-family:Segoe UI Light; font-size:100%; text-align:center;border-bottom:solid #BDD1DE" width="16.6%" | | | style="font-family:Segoe UI Light; font-size:100%; text-align:center;border-bottom:solid #BDD1DE" width="16.6%" | | ||
| − | [[ | + | [[Group08_application| <font size = 4; color="#4180AB">Application & User Guide</font>]] |
| style="font-family:Segoe UI Light; font-size:100%; text-align:center;border-bottom:solid #BDD1DE" width="16.6%" | | | style="font-family:Segoe UI Light; font-size:100%; text-align:center;border-bottom:solid #BDD1DE" width="16.6%" | | ||
| − | [[ | + | [[Group08_research_paper | <font size = 4; color="#4180AB">Research Paper</font>]] |
| style="font-family:Segoe UI Light; font-size:100%; text-align:center;border-bottom:solid #BDD1DE" width="16.6%" | | | style="font-family:Segoe UI Light; font-size:100%; text-align:center;border-bottom:solid #BDD1DE" width="16.6%" | | ||
| − | [[ | + | [[Project_Groups | <font size = 4; color="#4180AB">Back to Main ↗</font>]] |
|} | |} | ||
| Line 63: | Line 63: | ||
===<div style="font-family:Segoe UI Semibold;"><font size = 3; color="#176585">Travel Demand</font></div>=== | ===<div style="font-family:Segoe UI Semibold;"><font size = 3; color="#176585">Travel Demand</font></div>=== | ||
| − | Estimate the travel demand: Volume of people expected to travel between a particular origin and destination via a particular route and mode of travel ( | + | Estimate the travel demand: Volume of people expected to travel between a particular origin and destination via a particular route and mode of travel (direct bus) |
The app should also be able to: | The app should also be able to: | ||
| Line 69: | Line 69: | ||
* Show the Degree of Centrality - The number of regions a region is connected via bus services | * Show the Degree of Centrality - The number of regions a region is connected via bus services | ||
* Show the Closeness Centrality of every bus stops to identify how easily each bus stop can reach another bus stop | * Show the Closeness Centrality of every bus stops to identify how easily each bus stop can reach another bus stop | ||
| − | * Show the Betweenness Centrality of a bus stop | + | * Show the Betweenness Centrality of a bus stop on the shortest path between location to location |
* Show the Connectivity of a bus stop based on the region the area is connected to. (i.e. higher frequency of buses per hour, higher connectivity) | * Show the Connectivity of a bus stop based on the region the area is connected to. (i.e. higher frequency of buses per hour, higher connectivity) | ||
| Line 175: | Line 175: | ||
<font size = 3; color ="#0F334D | <font size = 3; color ="#0F334D | ||
"> | "> | ||
| − | |||
* [https://www.linkedin.com/in/jiayi-chan123456/ Chan Jia Yi] | * [https://www.linkedin.com/in/jiayi-chan123456/ Chan Jia Yi] | ||
| − | * [https://www.linkedin.com/in/yongshan-koh/ Koh | + | * [https://www.linkedin.com/in/yongshan-koh/ Koh Yongshan] |
* [https://www.linkedin.com/in/mylee1/ Lee Meng Yong] | * [https://www.linkedin.com/in/mylee1/ Lee Meng Yong] | ||
| + | |||
| + | <div style=background:#ffffff border:#A3BFB1> | ||
| + | [[File:Teammates.JPG|700px|frameless|center]] | ||
| + | </div> | ||
</font></div></div></div> | </font></div></div></div> | ||
| Line 195: | Line 198: | ||
* [https://neo4j.com/developer/r/ Neo4j] | * [https://neo4j.com/developer/r/ Neo4j] | ||
* [https://cran.r-project.org/web/packages/leaflet/index.html leaflet] | * [https://cran.r-project.org/web/packages/leaflet/index.html leaflet] | ||
| + | * [https://cran.r-project.org/web/packages/ggcorrplot/index.html ggcorrplot] | ||
| + | * [https://cran.r-project.org/web/packages/tidygraph/index.html tidygraph] | ||
| + | * [https://cran.r-project.org/web/packages/heatmaply/index.html heatmaply] | ||
| + | * [https://cran.r-project.org/web/packages/MASS/index.html MASS] | ||
| + | * [https://cran.r-project.org/web/packages/ERSA/index.html ERSA] | ||
| + | * [https://cran.r-project.org/web/packages/CARS/index.html CAR] | ||
| + | * [https://cran.r-project.org/web/packages/rgdal/index.html RGDAL] | ||
</font></div></div></div> | </font></div></div></div> | ||
| Line 203: | Line 213: | ||
"> | "> | ||
* [https://www.mytransport.sg/content/mytransport/home/dataMall.html Land Transport Datamall Documentation - published by LTA] | * [https://www.mytransport.sg/content/mytransport/home/dataMall.html Land Transport Datamall Documentation - published by LTA] | ||
| + | *[https://ink.library.smu.edu.sg/cgi/viewcontent.cgi?referer=https://www.google.com/&httpsredir=1&article=3099&context=sis_research Time-Series Data Mining in Transportation: A Case Study on Singapore Public Train Commuter Travel Patterns] | ||
* [https://www.researchgate.net/publication/254746478_Spatial_Network_Analysis_of_Public_Transport_Systems_Developing_a_Strategic_Planning_Tool_to_Assess_the_Congruence_of_Movement_and_Urban_Structure_in_Australian_Cities Spatial Network Analysis of Public Transport Systems - ''published by Data2X''] | * [https://www.researchgate.net/publication/254746478_Spatial_Network_Analysis_of_Public_Transport_Systems_Developing_a_Strategic_Planning_Tool_to_Assess_the_Congruence_of_Movement_and_Urban_Structure_in_Australian_Cities Spatial Network Analysis of Public Transport Systems - ''published by Data2X''] | ||
* [https://www.comp.nus.edu.sg/~wongls/psZ/xiuju-lta10.pdf Weighted complex network analysis of travel route in Singapore public transport system- ''published by NUS''] | * [https://www.comp.nus.edu.sg/~wongls/psZ/xiuju-lta10.pdf Weighted complex network analysis of travel route in Singapore public transport system- ''published by NUS''] | ||
Latest revision as of 17:03, 26 April 2020
Contents
Overview
Singapore's public transport use rose to hit a record high in 2018, with a total of 7.54 million trips made on buses or trains each day.[1]
Here's what may come across your mind : Do you ever have experiences where a bus ride that is supposed to be short and quick took way longer than expected? Are you frustrated that the bus stops at every stop even though there’s nobody boarding or alighting? And why do we have so many bus stops that almost nobody uses?
What if we can reimagine the public bus network in Singapore through data?
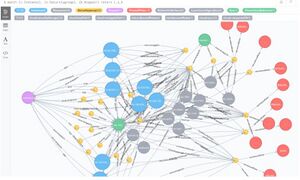
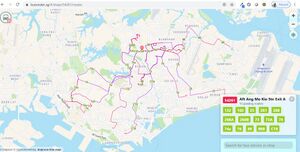
In this project, we will use data visualization techniques to map out all transportation nodes in Singapore, and re-propose a different way of organizing our bus services, which include bus stops, bus routes, and connectivity within subregion and from subregions to another subregion.
Scope
The scope of the project is limited to public buses in Singapore.
In order to map out the pattern of transportation in Singapore, we will mainly be using datasets from LTA datamall (https://www.mytransport.sg/content/mytransport/home/dataMall.html). In addition, we may supplement the data with other relevant datasets, such as geographical socioeconomic data, land use data (industrial area, commercial area, residential area), population density, or weather data.
Approach
We will use a primal approach to the analysis of movement networks, by treating intersections as nodes and street segments as edges.[2]
The app aims to provide policy makers with the following information:
Transportation Flow
- Visualise the flow of people across the bus stops/planning subzones and the criticality of the bus stops/planning subzones to Singapore’s public bus transport network.
Travel Demand
Estimate the travel demand: Volume of people expected to travel between a particular origin and destination via a particular route and mode of travel (direct bus)
The app should also be able to:
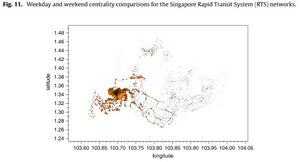
- Show the Degree of Centrality - The number of regions a region is connected via bus services
- Show the Closeness Centrality of every bus stops to identify how easily each bus stop can reach another bus stop
- Show the Betweenness Centrality of a bus stop on the shortest path between location to location
- Show the Connectivity of a bus stop based on the region the area is connected to. (i.e. higher frequency of buses per hour, higher connectivity)
We have a few recommendations for the network assessment task:
- Out of all possible paths in between 2 points in a network, the model we propose needs to discriminate in favour of paths that occurs in a minimum number of transfers between public buses.
- When considering transfers along a path between 2 points in a network, the model needs to define consistent standards of number of nodes to be recommended as an interchange node.
- Wherever a pair of nodes is connected by a minimum of two edges, the path with the lowest cumulative distance has been chosen, regardless of the number of transfers required.
- Diffusing some travel demand away from its trunk routes and thus of achieving more geographically balanced passenger flows with fewer squeeze points for capacity
Outcome
Where the visualisation could have useful practical implications to inform decision makers on policy making decisions in order to:
- Optimise bus routes to improve route utilisation. Reduce number of bus stops a service stops at to reduce congestion
- Optimise bus routes which could help to reduce congestion along certain bus stops
- Planning of bus stops, where should we place bus stops in order to maximize overall utility
- Plan the frequency of buses at certain times to minimize bus wait time and maximize throughput
- Advice city planners with regards to transportation flow in congested areas
Data Source
We will primarily be using data from LTA Data Mall [3]. Data is not publically available but available upon a written request. For this project, we will need to write a script in order to make an API call to extract the data we need. Data includes Live data as well as Historical data.
Bus Arrival
Live data. Returns real-time Bus Arrival information for Bus Services at a queried Bus Stop, including: Estimated Time of Arrival (ETC), Estimated Location, Load information (how crowded the bus is).
Bus Services
Returns detailed service information for all buses currently in operation, including: first stop, last stop, peak / off peak frequency of dispatch.
Bus Route
Returns detailed route information for all services currently in operation, including: all bus stops along each route, first/last bus timings for each stop.
Bus Stops
Returns detailed information for all bus stops currently being services by buses, including: Bus Stop Code, location coordinates.
Passenger Volume by Bus Stops
Returns tap in and tap out passenger volume by weekdays and weekends for individual bus stop.
Passenger Volume by Origin Destination Bus Stops
Returns number of trips by weekdays and weekends from the origin to destination bus stops.
Visualization Feature
Methodology
We started this project with a broad question in mind, ‘How can we improve the bus transportation system in Singapore’. The methodology of the project is iterative in nature, we will build broad visualization, identify areas to deep dive and propose solutions for these issues.
- Data Extraction - Requesting for access to data from LTA and building API interface to extract data
- Preliminary study - Reading up on existing work done on Singapore bus transportation network and understand transportation engineering models
- First phase analysis and visualization - Building of high level visualizations to clearly show status quo and areas for improvement
- Second phase analysis and visualization - Deep dive into issues and identify solutions
- Implementation - Build R-Shiny app and report
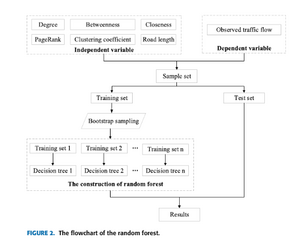
Solution may include graphical analysis, geospatial analysis in the realm of transport engineering such as Gravity Model(Multiple Regression Model), Network analysis, modelling Centrality.
Limitations
- We wont be accessing Information Centrality because we assume we wont be removing any bus stops
- Due to data limitations and security, we won't be assessing actual waiting time, frequency and actual travelling time.
- As our project focuses on buses, we will ignore the connectivity due to trains and other forms of public transportations.
Team Members
Tools and Packages
Reference
- Land Transport Datamall Documentation - published by LTA
- Time-Series Data Mining in Transportation: A Case Study on Singapore Public Train Commuter Travel Patterns
- Spatial Network Analysis of Public Transport Systems - published by Data2X
- Weighted complex network analysis of travel route in Singapore public transport system- published by NUS
- Graphical visualisation of flows - published by Flows Mag
- Rerouting Buses using Data Science - Part I- published by Govtech Singapore
- Modelling the public transport network - Part II- published by Govtech Singapore
- How Govtech simulates four million bus rides a day- published by Govtech Singapore
- Journey to the end of the line - SMU MITB Project, Group 2 T17/18- published by SMU MITB
- Interactive Web Maps with R- published by R Studio
- Public Transport Singapore 2020- Budget Direct Singapore
- Spatial Network Analysis of Public Transport Systems: Developing a Strategic Planning Tool to Assess the Congruence of Movement and Urban Structure in Australian Cities- Research Gate
- LTA public transport data- LTA datamall
- A Multiple Regression Approach for Traffic Flow Estimation- Research Gate
- ↑ https://www.budgetdirect.com.sg/car-insurance/research/public-transport-singapore
- ↑ https://www.researchgate.net/publication/254746478_Spatial_Network_Analysis_of_Public_Transport_Systems_Developing_a_Strategic_Planning_Tool_to_Assess_the_Congruence_of_Movement_and_Urban_Structure_in_Australian_Cities
- ↑ https://www.mytransport.sg/content/mytransport/home/dataMall/dynamic-data.html
- ↑ https://www.researchgate.net/publication/331690357_A_Multiple_Regression_Approach_for_Traffic_Flow_Estimation

