Difference between revisions of "Group11 proposal"
m |
m (→References) |
||
| (147 intermediate revisions by 3 users not shown) | |||
| Line 1: | Line 1: | ||
| − | + | [[File:G11 TitleBanner2.png|1700px|frameless|SGSAS]] | |
| − | [[File: | ||
| − | |||
<div> | <div> | ||
| − | {|style="background-color:# | + | {|style="background-color:#607080;" width="100%" cellspacing="0" cellpadding="0" valign="top" border="0" | |
| − | | style="font-family:Century Gothic; font-size:100%; solid # | + | | style="font-family:Century Gothic; font-size:100%; solid #103080; background:#20a0d0; text-align:center;" width="20%" | |
; | ; | ||
[[Group11_proposal| <font color="#FFFFFF">Proposal</font>]] | [[Group11_proposal| <font color="#FFFFFF">Proposal</font>]] | ||
| − | | style="font-family:Century Gothic; font-size:100%; solid # | + | | style="font-family:Century Gothic; font-size:100%; solid #103080; background:#607080; text-align:center;" width="20%" | |
; | ; | ||
| − | [[ | + | [[Group11_poster| <font color="#FFFFFF">Poster</font>]] |
| − | | style="font-family:Century Gothic; font-size:100%; solid # | + | | style="font-family:Century Gothic; font-size:100%; solid #103080; background:#607080; text-align:center;" width="20%" | |
; | ; | ||
| − | [[ | + | [[Group11_application| <font color="#FFFFFF">Application</font>]] |
| − | | style="font-family:Century Gothic; font-size:100%; solid # | + | |
| + | | style="font-family:Century Gothic; font-size:100%; solid #103080; background:#607080; text-align:center;" width="20%" | | ||
; | ; | ||
| − | [[ | + | [[Group11_user_guide| <font color="#FFFFFF">Application User Guide</font>]] |
| − | | | + | | style="font-family:Century Gothic; font-size:100%; solid #103080; background:#607080; text-align:center;" width="20%" | |
| + | ; | ||
| + | [[Group11_research_paper| <font color="#FFFFFF">Research Paper</font>]] | ||
|} | |} | ||
| − | |||
| − | |||
</div> | </div> | ||
<br> | <br> | ||
| − | |||
| − | |||
| − | |||
| − | |||
| − | == | + | == Background == |
| − | + | [[File:G11 MapUK.png|1000px|frameless]] <br /> | |
| + | Grocery data from in-store purchases of 411 Tesco shops in the Greater London area are used in this R Shiny application. In this project, we will focus on using the nutrients information from this dataset at 4 different spatial granularities, Lower Super Output Areas (LSOA), Middle Layer Super Output Areas (MSOA), ward and Local Authority Districts (LAD). | ||
| + | |||
| + | The analysis is performed, notably through four sections: | ||
| + | # Exploratory Data Analysis (EDA) | ||
| + | # Exploratory Spatial Data Analysis (ESDA) | ||
| + | # Clustering (Hierarchical, GeoSpatial, Skater Clustering) | ||
| + | # Geographically weighted regression (GWR) | ||
| + | |||
| + | |||
| + | == Motivation == | ||
| + | The recent availability of this dataset provides us with an opportunity to work on information that is current. This dataset also combines geospatial data with aspatial information that allows us to apply geospatial regression techniques and geospatial clustering to understand nutrition and obesity at different geographic granularity. | ||
| + | |||
| + | Despite the importance of studying food consumption at scale, there is little data about what people actually eat over long periods of time. Our analysis will link these food consumption data of an area in Greater London through both aspatial and geospatial methods. We will attempt to analyze the eating habits of Londoners based on this dataset through a non-biased, non-personalized lens that is prevalent in current web data from social media and geo-referenced media. | ||
| + | |||
| + | == Project Objectives == | ||
| + | The project aims to deliver an R-Shiny app that provides: | ||
| + | # Interactive user interface design | ||
| + | # Nutritional information interfaced with a visual map representation | ||
| + | # Clustering techniques through both aspatial and geospatial methods | ||
| + | # Geographically weighted Regression (GWR) of nutritional data and obesity | ||
| + | |||
| + | |||
| + | == Proposed Scope and Methodology == | ||
| + | # Analysis of Tesco Grocery dataset with background research | ||
| + | # Exploratory Data Analysis (EDA) methods in R | ||
| + | # Exploratory Spatial Data Analysis (ESDA) methods in R | ||
| + | # Clustering methods for aspatial and geospatial information in R | ||
| + | # Analysis of geographically weighted regression (GWR) in R | ||
| + | # R Markdown development for functionality checks | ||
| + | # R-Shiny app development for user interactivity | ||
| − | |||
| − | |||
| − | |||
| − | |||
| − | |||
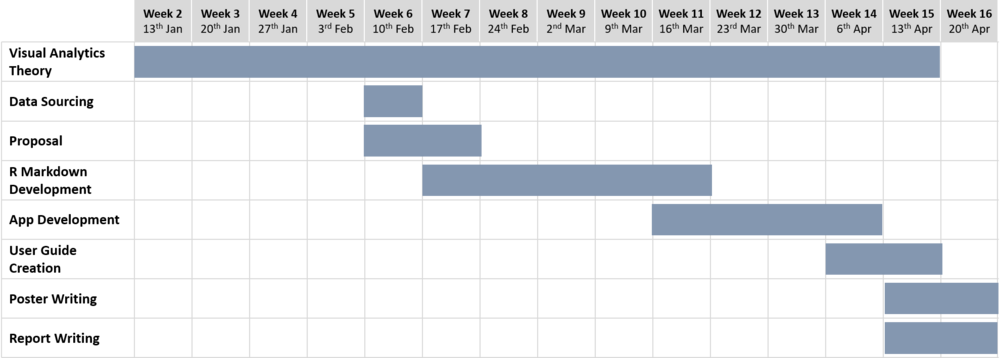
| − | + | A generalized development timeframe for this project is shown below. <br /> | |
| − | + | [[File:Gen Gantt2.png|1000px|frameless]] | |
| − | |||
| − | + | == Storyboard & Visualization Features == | |
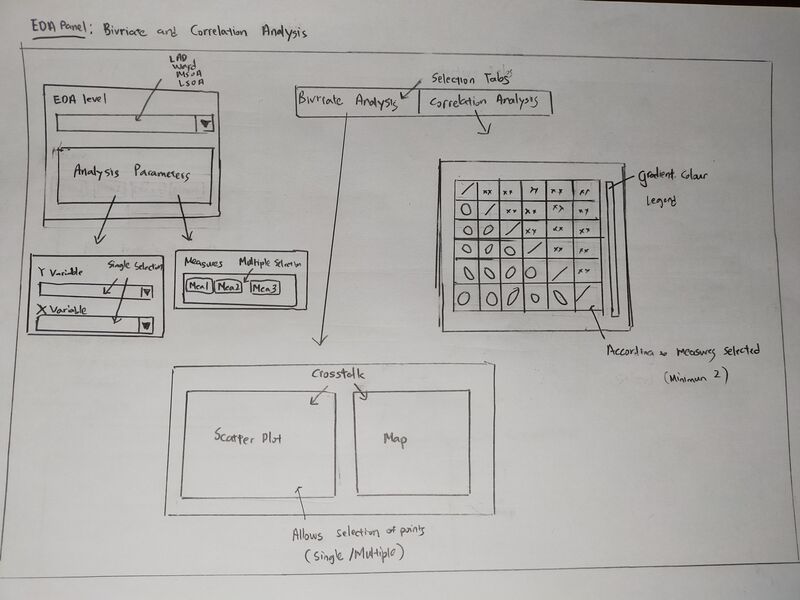
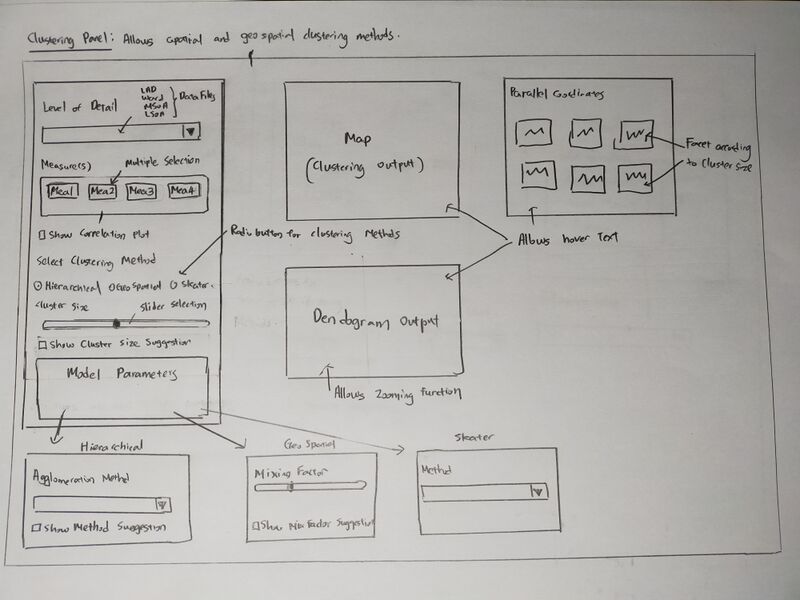
| + | There will be five sections in the final App. Data exploration will be done in the first two sections using scatterplots, correlation plots, and Local Indicator of Spatial Autocorrelation (LISA). | ||
| + | The next two sections will be the clustering methods and geographically weighted regression. | ||
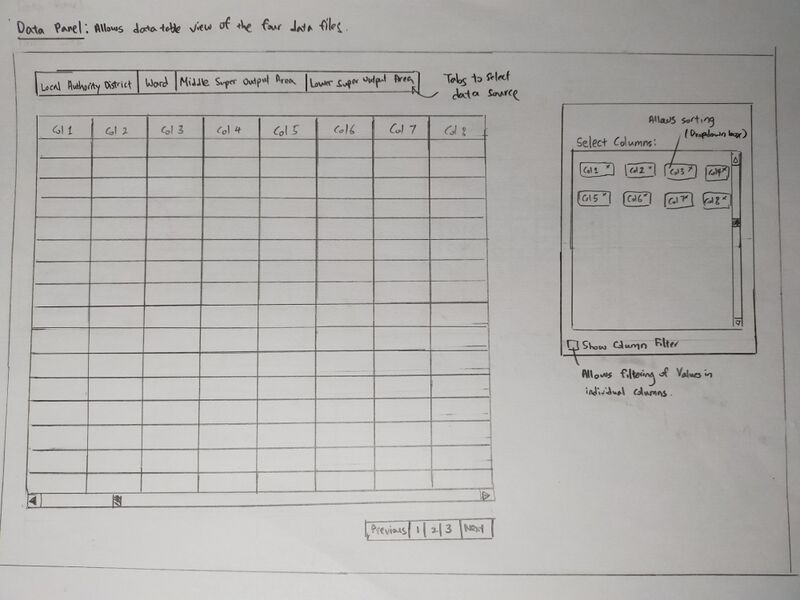
| + | The last section will show the 4 transformed final data tables used in the application. <br /> | ||
| + | <p>Exploratory Data Analysis <br />[[File:G11 Stb A.jpg|800px|frameless|EDA]] | ||
| + | <p>Exploratory Spatial Data Analysis <br />[[File:G11 Stb B.jpg|800px|frameless|ESDA]] | ||
| + | <p>Clustering <br />[[File:G11 Stb C.jpg|800px|frameless|Clustering]] | ||
| + | <p>Geographically weighted regression <br />[[File:G11 Stb D.jpg|800px|frameless|GWR]] | ||
| + | <p>Data Table <br />[[File:Stb E.jpg|800px|frameless|Data Table]] | ||
| − | |||
| − | == | + | == Software Tools == |
| − | + | * RStudio: https://rstudio.com/ | |
| − | + | ||
| − | + | == R Packages == | |
| − | + | * shiny: https://shiny.rstudio.com | |
| − | + | * shinythemes: https://cran.r-project.org/web/packages/shinythemes | |
| − | + | * shinyWidgets: https://cran.r-project.org/web/packages/shinyWidgets | |
| − | + | * RColorBrewer: https://cran.r-project.org/web/packages/RColorBrewer | |
| − | + | * tidyverse: https://www.tidyverse.org | |
| − | + | * leaflet: https://cran.r-project.org/web/packages/leaflet | |
| − | + | * tmap: https://cran.r-project.org/web/packages/tmap | |
| − | + | * spdep: https://cran.r-project.org/web/packages/spdep | |
| − | + | * rgeos: https://cran.r-project.org/web/packages/rgeos | |
| − | + | * sf: https://cran.r-project.org/web/packages/sf | |
| − | + | * sp: https://cran.r-project.org/web/packages/sp | |
| − | + | * rgdal: https://cran.r-project.org/web/packages/rgdal | |
| + | * GWmodel: https://cran.r-project.org/web/packages/GWmodel | ||
| + | * plotly: https://cran.r-project.org/web/packages/plotly | ||
| + | * ClustGeo: https://cran.r-project.org/web/packages/ClustGeo | ||
| + | * dendextend https://cran.r-project.org/web/packages/dendextend | ||
| + | * GGally: https://cran.r-project.org/web/packages/GGally | ||
| + | * ggdendro: https://cran.r-project.org/web/packages/ggdendro | ||
| + | * corrplot: https://cran.r-project.org/web/packages/corrplot | ||
| + | * DT: https://cran.r-project.org/web/packages/DT | ||
| + | |||
| + | == Team Members == | ||
| + | * LI Junyi Darren | ||
| + | * Muhammad Jufri Bin RAMLI | ||
| + | * TEO Lip Peng Raymond | ||
| + | |||
| + | == References == | ||
| + | *[https://www.nature.com/articles/s41597-020-0397-7 Tesco Grocery 1.0, a large-scale dataset of grocery purchases in London] | ||
| + | *[https://figshare.com/collections/Tesco_Grocery_1_0/4769354/2 Tesco Grocery 1.0 dataset] | ||
| + | *[https://springernature.figshare.com/articles/Metadata_record_for_Tesco_Grocery_1_0_a_large-scale_dataset_of_grocery_purchases_in_London/11799765 Metadata record for: Tesco Grocery 1.0] | ||
| + | *[https://epjdatascience.springeropen.com/articles/10.1140/epjds/s13688-019-0191-y Large-scale and high-resolution analysis of food purchases and health outcomes] | ||
| + | *[https://geoportal.statistics.gov.uk/datasets/guide-to-presenting-statistics-for-super-output-areas-june-2018 Guide to presenting statistics for Super Output Areas (June 2018)] | ||
| + | *[https://webarchive.nationalarchives.gov.uk/20170110165409/https://www.noo.org.uk/visualisation Data on child obesity and excess weight at small area level] | ||
| + | *[https://en.wikipedia.org/wiki/Greater_London Wikipedia: Greater London] | ||
| + | *[https://geoportal.statistics.gov.uk/datasets/regions-december-2019-boundaries-en-bgc Regions (December 2019) Boundaries EN BGC] | ||
| + | *[https://geoportal.statistics.gov.uk/datasets/local-authority-districts-december-2019-boundaries-uk-bgc Local Authority Districts (December 2019) Boundaries UK BGC] | ||
| + | *[https://geoportal.statistics.gov.uk/datasets/wards-december-2019-boundaries-ew-bgc Wards (December 2019) Boundaries EW BGC] | ||
| + | *[https://geoportal.statistics.gov.uk/datasets/middle-layer-super-output-areas-december-2011-boundaries-ew-bgc Middle Layer Super Output Areas (December 2011) Boundaries EW BGC] | ||
| + | *[https://geoportal.statistics.gov.uk/datasets/lower-layer-super-output-areas-december-2011-boundaries-ew-bgc Lower Layer Super Output Areas (December 2011) Boundaries EW BGC] | ||
| + | *[https://sk.sagepub.com/reference/geography/n406.xml Exploratory Spatial Data Analysis - Jin Chen] | ||
| + | *[https://sk.sagepub.com/reference/geoinfoscience/n64.xml Exploratory Spatial Data Analysis (ESDA) - Chris Brunsdon] | ||
| + | *[https://pro.arcgis.com/en/pro-app/tool-reference/spatial-statistics/how-geographicallyweightedregression-works.htm How Geographically Weighted Regression (GWR) works] | ||
| + | *[https://arxiv.org/abs/1306.0413 GWmodel: an R Package for Exploring Spatial Heterogeneity using Geographically Weighted Models] | ||
| + | *[https://arxiv.org/abs/1312.2753 The GWmodel R package: Further Topics for Exploring Spatial Heterogeneity using Geographically Weighted Models] | ||
| + | *[https://arxiv.org/abs/1905.00266 Scalable GWR: A linear-time algorithm for large-scale geographically weighted regression with polynomial kernels] | ||
| + | *[http://mural.maynoothuniversity.ie/7850/1/MC_Minkowski.pdf The Minkowski approach for choosing the distance metric in geographically weighted regression ] | ||
| + | *[https://wiki.smu.edu.sg/1819t3isss608/Group09_Methodology UK's access to health assets and hazards] | ||
| + | *[https://wiki.smu.edu.sg/18191isss608g1/ISSS608_Group07_Proposal Corn: The A-maize-ing Crop] | ||
Latest revision as of 09:06, 3 May 2020
Contents
Background
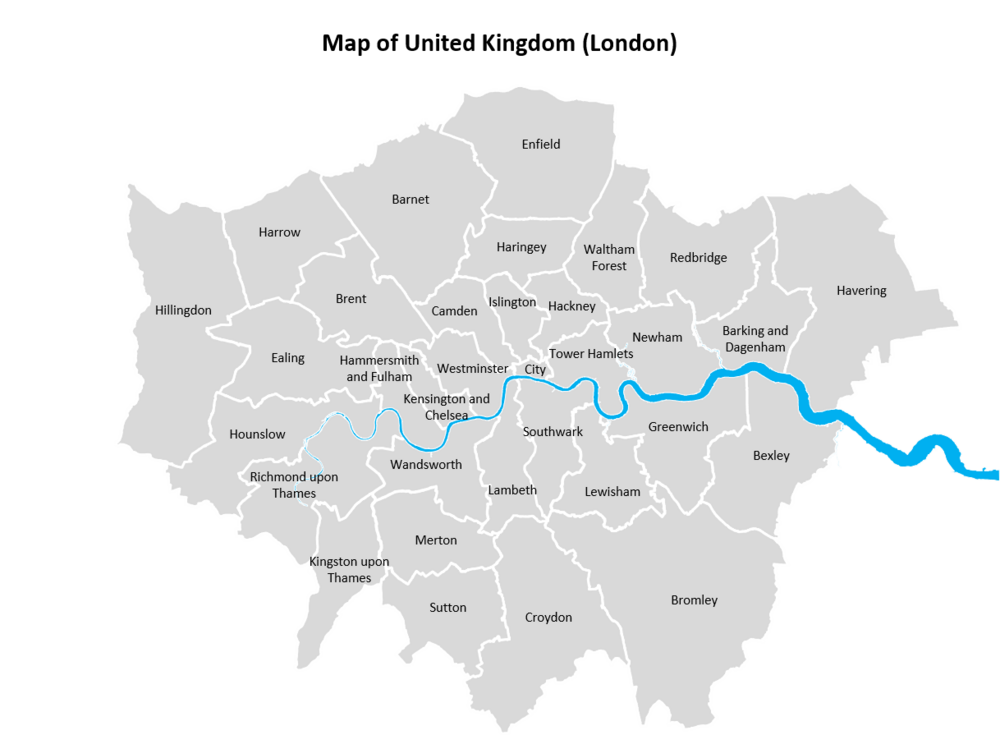
Grocery data from in-store purchases of 411 Tesco shops in the Greater London area are used in this R Shiny application. In this project, we will focus on using the nutrients information from this dataset at 4 different spatial granularities, Lower Super Output Areas (LSOA), Middle Layer Super Output Areas (MSOA), ward and Local Authority Districts (LAD).
The analysis is performed, notably through four sections:
- Exploratory Data Analysis (EDA)
- Exploratory Spatial Data Analysis (ESDA)
- Clustering (Hierarchical, GeoSpatial, Skater Clustering)
- Geographically weighted regression (GWR)
Motivation
The recent availability of this dataset provides us with an opportunity to work on information that is current. This dataset also combines geospatial data with aspatial information that allows us to apply geospatial regression techniques and geospatial clustering to understand nutrition and obesity at different geographic granularity.
Despite the importance of studying food consumption at scale, there is little data about what people actually eat over long periods of time. Our analysis will link these food consumption data of an area in Greater London through both aspatial and geospatial methods. We will attempt to analyze the eating habits of Londoners based on this dataset through a non-biased, non-personalized lens that is prevalent in current web data from social media and geo-referenced media.
Project Objectives
The project aims to deliver an R-Shiny app that provides:
- Interactive user interface design
- Nutritional information interfaced with a visual map representation
- Clustering techniques through both aspatial and geospatial methods
- Geographically weighted Regression (GWR) of nutritional data and obesity
Proposed Scope and Methodology
- Analysis of Tesco Grocery dataset with background research
- Exploratory Data Analysis (EDA) methods in R
- Exploratory Spatial Data Analysis (ESDA) methods in R
- Clustering methods for aspatial and geospatial information in R
- Analysis of geographically weighted regression (GWR) in R
- R Markdown development for functionality checks
- R-Shiny app development for user interactivity
A generalized development timeframe for this project is shown below.
Storyboard & Visualization Features
There will be five sections in the final App. Data exploration will be done in the first two sections using scatterplots, correlation plots, and Local Indicator of Spatial Autocorrelation (LISA).
The next two sections will be the clustering methods and geographically weighted regression.
The last section will show the 4 transformed final data tables used in the application.
Exploratory Spatial Data Analysis 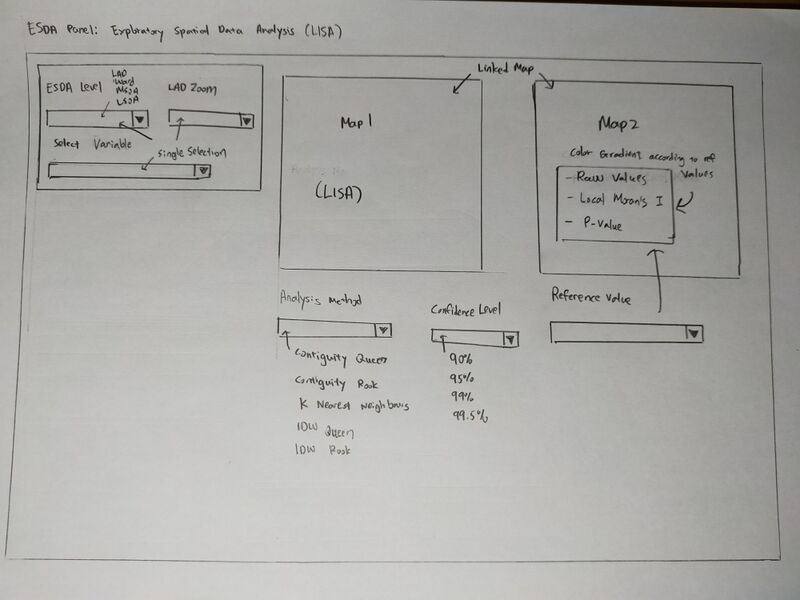
Geographically weighted regression 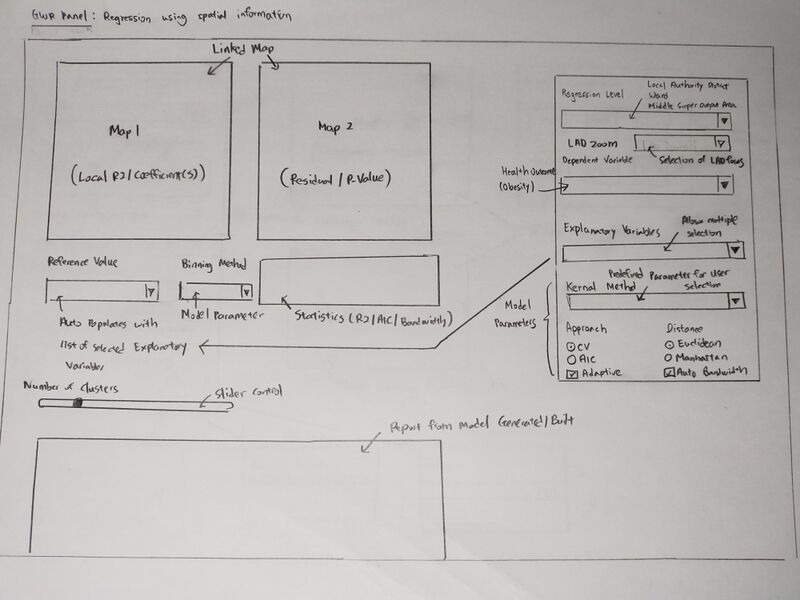
Software Tools
- RStudio: https://rstudio.com/
R Packages
- shiny: https://shiny.rstudio.com
- shinythemes: https://cran.r-project.org/web/packages/shinythemes
- shinyWidgets: https://cran.r-project.org/web/packages/shinyWidgets
- RColorBrewer: https://cran.r-project.org/web/packages/RColorBrewer
- tidyverse: https://www.tidyverse.org
- leaflet: https://cran.r-project.org/web/packages/leaflet
- tmap: https://cran.r-project.org/web/packages/tmap
- spdep: https://cran.r-project.org/web/packages/spdep
- rgeos: https://cran.r-project.org/web/packages/rgeos
- sf: https://cran.r-project.org/web/packages/sf
- sp: https://cran.r-project.org/web/packages/sp
- rgdal: https://cran.r-project.org/web/packages/rgdal
- GWmodel: https://cran.r-project.org/web/packages/GWmodel
- plotly: https://cran.r-project.org/web/packages/plotly
- ClustGeo: https://cran.r-project.org/web/packages/ClustGeo
- dendextend https://cran.r-project.org/web/packages/dendextend
- GGally: https://cran.r-project.org/web/packages/GGally
- ggdendro: https://cran.r-project.org/web/packages/ggdendro
- corrplot: https://cran.r-project.org/web/packages/corrplot
- DT: https://cran.r-project.org/web/packages/DT
Team Members
- LI Junyi Darren
- Muhammad Jufri Bin RAMLI
- TEO Lip Peng Raymond
References
- Tesco Grocery 1.0, a large-scale dataset of grocery purchases in London
- Tesco Grocery 1.0 dataset
- Metadata record for: Tesco Grocery 1.0
- Large-scale and high-resolution analysis of food purchases and health outcomes
- Guide to presenting statistics for Super Output Areas (June 2018)
- Data on child obesity and excess weight at small area level
- Wikipedia: Greater London
- Regions (December 2019) Boundaries EN BGC
- Local Authority Districts (December 2019) Boundaries UK BGC
- Wards (December 2019) Boundaries EW BGC
- Middle Layer Super Output Areas (December 2011) Boundaries EW BGC
- Lower Layer Super Output Areas (December 2011) Boundaries EW BGC
- Exploratory Spatial Data Analysis - Jin Chen
- Exploratory Spatial Data Analysis (ESDA) - Chris Brunsdon
- How Geographically Weighted Regression (GWR) works
- GWmodel: an R Package for Exploring Spatial Heterogeneity using Geographically Weighted Models
- The GWmodel R package: Further Topics for Exploring Spatial Heterogeneity using Geographically Weighted Models
- Scalable GWR: A linear-time algorithm for large-scale geographically weighted regression with polynomial kernels
- The Minkowski approach for choosing the distance metric in geographically weighted regression
- UK's access to health assets and hazards
- Corn: The A-maize-ing Crop

