Difference between revisions of "Group07 proposal"
| (14 intermediate revisions by 2 users not shown) | |||
| Line 1: | Line 1: | ||
| − | [[File: | + | [[File:G7titlepic.jpg|center|700px|Home - PicSource: https://cryptonews.com/news/the-beginner-s-guide-to-cryptocurrency-trading-1036.htm]] |
<br/> | <br/> | ||
</div> | </div> | ||
| Line 34: | Line 34: | ||
<br> | <br> | ||
| + | |||
== <big>Project Motivation and Objectives</big> == | == <big>Project Motivation and Objectives</big> == | ||
| Line 44: | Line 45: | ||
<br> | <br> | ||
| + | == <big>Data Source</big> == | ||
| + | '''Dataset''' | ||
| + | |||
| + | The dataset of [https://www.kaggle.com/philmohun/cryptocurrency-financial-data Complete Historical Cryptocurrency Financial Data - Top 200 Cryptocurrencies by Marketcap] contains the following: | ||
| + | |||
| + | *Currency: Name of currency:the data source contains 12 kinds of cryptocurrency.(Binance-coin, Bitcoin, Bitcoin-cash, Bitcoin-sv, Cardano, Eos, Ethereum, Litecoin, Stellar, Tether, Tezos and XRP) | ||
| + | *Date: Date refers to the calendar date for the particular row - 24 hours midnight to midnight.(From 28/04/2013 to 04/12/2019) | ||
| + | *Open: Open is what the price was at the beginning of the day | ||
| + | *High: Highest recorded trading price of the day | ||
| + | *Low: Lowest recorded trading price of the day | ||
| + | *Close: Close is what the price was at the end of the day | ||
| + | *Volume: Volume represents the monetary value of the currency traded in a 24 hour period, denoted in USD | ||
| + | *Market Cap: Market cap is circulating supply x price of the coin. For example, if you have 100 coins that are worth $10 each your market cap is $1,000 | ||
| + | <br> | ||
| Line 66: | Line 81: | ||
===Time Series Forecasting=== | ===Time Series Forecasting=== | ||
| + | *<p>[https://www.mdpi.com/1911-8074/12/3/150/htm Bohte, R., Rossini, L., & Econometrics and Operations Research. (2019). Comparing the Forecasting of Cryptocurrencies by Bayesian Time-Varying Volatility Models. Journal of Risk and Financial Management, 12(3), 1–18. https://doi.org/10.3390/jrfm12030150] <p> | ||
| + | *<p>[https://www.shs-conferences.org/articles/shsconf/pdf/2019/06/shsconf_m3e22019_02001.pdf Derbentsev Vasily, Datsenko Natalia, Stepanenko Olga, & Bezkorovainyi Vitaly. (2019). Forecasting cryptocurrency prices time series using machine learning approach. SHS Web of Conferences, 65. https://doi.org/10.1051/shsconf/20196502001] <p> | ||
| + | <br> | ||
| + | We find several articles that show the different model of time series forecasting on cryptocurrency prices. Different Bayesian models, classic algorithm classification, regression trees (C&RT) and autoregressive models ARIMA are compared, including models with constant and time-varying volatility, such as stochastic volatility and GARCH. We still need to do further research to decide which model we are going to use that is appropriate for our dataset. | ||
<br> | <br> | ||
| + | == <big>Dashboard Sketch<big/> == | ||
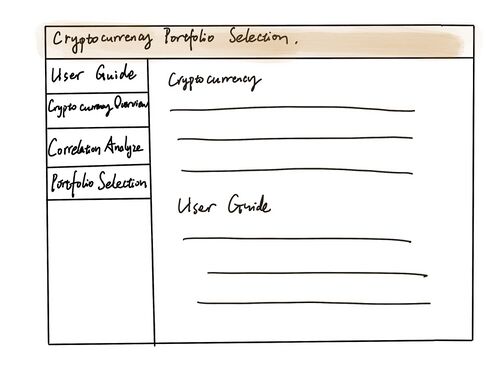
| − | == | + | ===<small>Dashboard for user guide</small>=== |
| − | |||
| − | |||
[[File:Dashboard1.jpg|500px|thumb|left]] | [[File:Dashboard1.jpg|500px|thumb|left]] | ||
| − | </br></br></br></br></br></br></br></br></br></br></br></br></br></br></br></br></br> | + | </br></br></br></br></br></br></br></br></br></br></br></br></br></br></br></br> |
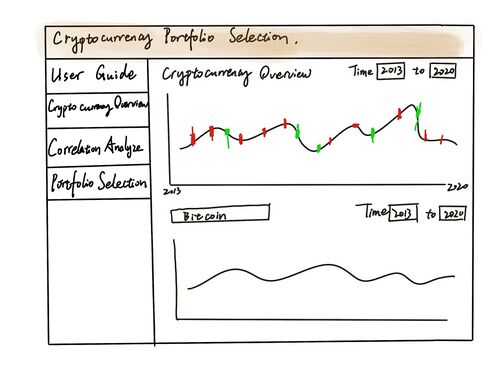
| − | + | ===<small>Dashboard for Cryptocurrency Overview</small>=== | |
| − | [[File: | + | [[File:2.jpg|500px|thumb|left]] |
| + | </br></br></br></br></br></br></br></br></br></br></br></br></br></br></br></br> | ||
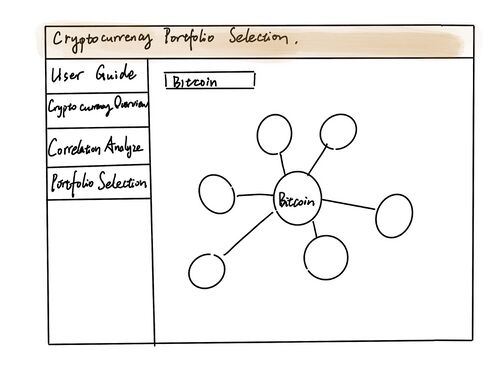
| + | ===<small>Dashboard for Correlation</small>=== | ||
| + | [[File:3.jpg|500px|thumb|left]] | ||
| + | </br></br></br></br></br></br></br></br></br></br></br></br></br></br></br></br> | ||
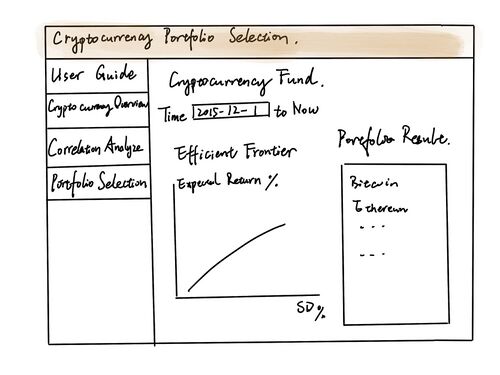
| + | ===<small>Dashboard for Portfolio Selection</small>=== | ||
| + | [[File:4.jpg|500px|thumb|left]] | ||
</br></br></br></br></br></br></br></br></br></br></br></br></br></br></br></br> | </br></br></br></br></br></br></br></br></br></br></br></br></br></br></br></br> | ||
<br> | <br> | ||
| − | |||
| − | |||
| − | |||
| − | |||
| − | |||
| − | |||
| − | |||
| − | |||
| − | |||
| − | |||
| − | |||
| − | |||
| − | |||
| − | |||
== <big>Tools & R Packages</big> == | == <big>Tools & R Packages</big> == | ||
Latest revision as of 00:13, 27 April 2020
|
|
|
|
|
|
Contents
Overview
As of March 2018, there are 1,658 cryptocurrencies in existence. The total cryptocurrency market capitalization is just under $369 billion. With the help of cryptography and a collective booking system called blockchain, cryptocurrencies build a distributed, safe and decentralized payment system, which does not need banks, intermediates, an organization or a central technical infrastructure to work.
However, mainly due to lack of regulatory support, Cryptocurrencies are highly volatile, which makes it a risky investment. Therefore, in this project, a Shiny web application is created with the cryptocurrency analysis in mind. It integrates three types of analysis: Time Series Analysis, Correlation Analysis and Portfolio Selection Analysis within one application. This application is made to be informative and allows potential investors of cryptocurrency to interact with the data embedded within the application, view the visualization and generate results based on the selected filters before they make decision on cryptocurrency investment.
Project Motivation and Objectives
We aim to achieve the following objectives in our project:
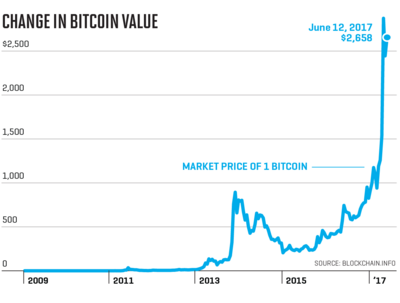
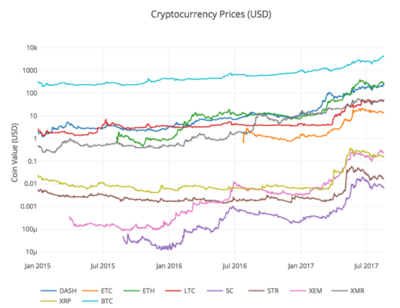
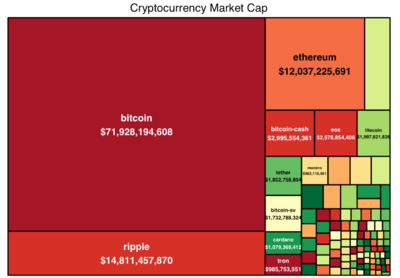
1. An overview of different cryptocurrency in time series, including open/close price, high/low price shown in a candlestick diagram and distribution of each cryptocurrency capital.
2. Correlation analyze among all cryptocurrency. Correlation analysis between Bitcoin and others cryptocurrency, which will help us reveal the similar price pattern of cryptocurrency.
3. Portfolio selection analyze in a deterministic optimization method. In this project, we will use this data as a starting point for a detailed analysis into what is driving price action, and what can be done to predict future movement.
Data Source
Dataset
The dataset of Complete Historical Cryptocurrency Financial Data - Top 200 Cryptocurrencies by Marketcap contains the following:
- Currency: Name of currency:the data source contains 12 kinds of cryptocurrency.(Binance-coin, Bitcoin, Bitcoin-cash, Bitcoin-sv, Cardano, Eos, Ethereum, Litecoin, Stellar, Tether, Tezos and XRP)
- Date: Date refers to the calendar date for the particular row - 24 hours midnight to midnight.(From 28/04/2013 to 04/12/2019)
- Open: Open is what the price was at the beginning of the day
- High: Highest recorded trading price of the day
- Low: Lowest recorded trading price of the day
- Close: Close is what the price was at the end of the day
- Volume: Volume represents the monetary value of the currency traded in a 24 hour period, denoted in USD
- Market Cap: Market cap is circulating supply x price of the coin. For example, if you have 100 coins that are worth $10 each your market cap is $1,000
Proposed Scope and Methodology
EDA (Exploratory Data Analysis)
Historical Price Analysis
- Comparing the historical price data of one cryptocurrency across different years.
- Comparing the historical price data in same year across different cryptocurrency.
Market Cap
According to the provided data, we can find out how the market cap of cyrptocurrencies is distributed by years.
Correlation Analysis
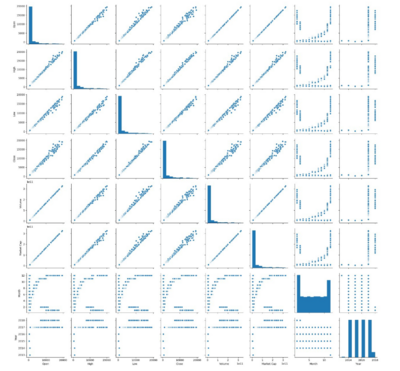
Seeking whether this is any correlation between two of the 12 cryptocurrencies is under consideration and project scope. Firstly, we will try to apply correlation matrix and pairplot to discover the possibility of strong correlation. Once we have the results, we can go deeper to justify the correlation using our whole dataset.
Time Series Forecasting
We find several articles that show the different model of time series forecasting on cryptocurrency prices. Different Bayesian models, classic algorithm classification, regression trees (C&RT) and autoregressive models ARIMA are compared, including models with constant and time-varying volatility, such as stochastic volatility and GARCH. We still need to do further research to decide which model we are going to use that is appropriate for our dataset.
Dashboard Sketch
Dashboard for user guide
Dashboard for Cryptocurrency Overview
Dashboard for Correlation
Dashboard for Portfolio Selection
Tools & R Packages
R Studio & Shiny
Packages:
- library(quantmod)
- library(xts)
- library(rvest)
- library(tidyverse)
- library(stringr)
- library(forcats)
- library(lubridate)
- library(plotly)
- library(dplyr)
- library(PerformanceAnalytics)
- etc.
Team Members
Chen Peng
peng.chen.2018@mitb.smu.edu.sg
Guo Yichao
yichao.guo.2018@mitb.smu.edu.sg
References
Strategy Guide: How to Pick the Best Cryptocurrency to Invest In
Can Bitcoin’s First Felon Help Make Cryptocurrency a Trillion-Dollar Market?

