Difference between revisions of "Group17 proposal"
| (18 intermediate revisions by 2 users not shown) | |||
| Line 1: | Line 1: | ||
| − | [[File:Cover | + | <div style=background:#808080 border:#003D73> |
| − | <div> | + | [[File:Cover page.jpg|300px]] |
| + | <font size = 4.5; color="#FFFFFF"> Geospatial Visual Analytics Tool for Exploring and Analyzing Armed Conflicts in South Asia </font> | ||
| + | </div> | ||
| + | <!--MAIN HEADER --> | ||
{|style="background-color:#808080;" width="100%" cellspacing="0" cellpadding="0" valign="top" border="0" | | {|style="background-color:#808080;" width="100%" cellspacing="0" cellpadding="0" valign="top" border="0" | | ||
| − | | style="font-family:Century Gothic; font-size:100%; solid #A9A9A9; background:#103080; text-align:center;" width=" | + | |
| + | | style="font-family:Century Gothic; font-size:100%; solid #A9A9A9; background:#103080; text-align:center;" width="20%" | | ||
; | ; | ||
| − | |||
| − | | style="font-family:Century Gothic; font-size:100%; solid #A9A9A9; background:#808080; text-align:center;" width=" | + | [[Group17_Proposal| <font color="#FFFFFF">Proposal</font>]] |
| + | |||
| + | | style="font-family:Century Gothic; font-size:100%; solid #A9A9A9; background:#808080; text-align:center;" width="20%" | | ||
; | ; | ||
| − | [[ | + | [[Group17_Poster| <font color="#FFFFFF">Poster</font>]] |
| − | | style="font-family:Century Gothic; font-size:100%; solid #A9A9A9; background:#808080; text-align:center;" width=" | + | | style="font-family:Century Gothic; font-size:100%; solid #A9A9A9; background:#808080; text-align:center;" width="20%" | |
; | ; | ||
| − | [[ | + | [[Group17_Application| <font color="#FFFFFF">Application</font>]] |
| − | | style="font-family:Century Gothic; font-size:100%; solid #A9A9A9; background:#808080; text-align:center;" width=" | + | | style="font-family:Century Gothic; font-size:100%; solid #A9A9A9; background:#808080; text-align:center;" width="20%" | |
; | ; | ||
| − | [[ | + | [[Group17_Research_paper| <font color="#FFFFFF">Practice Research Paper</font>]] |
|} | |} | ||
| + | <br> | ||
</div> | </div> | ||
| − | < | + | |
| + | <div> | ||
| + | |||
== Overview == | == Overview == | ||
| − | In this age of growing socio-political and cultural dissimilarities, the occurrences of armed conflicts have risen. This has been observed especially in nations that are in proximity to each other and those who share borders. Non-profit organizations like ACLED have been collating the data of such conflicts in a tabular form, analyzing such data and mapping the crisis of these events. By leveraging this data, which entails the conflict occurrences, date of conflicts, fatalities, types of conflicts, among other factors, we contribute a geo-spatial analytics tool to allow users to visualize the data for South Asian countries and garner insights with respect to conflict occurrences with great user experience. We | + | In this age of growing socio-political and cultural dissimilarities, the occurrences of armed conflicts have risen. This has been observed especially in nations that are in proximity to each other and those who share borders. Non-profit organizations like ACLED have been collating the data of such conflicts in a tabular form, analyzing such data and mapping the crisis of these events. By leveraging this data, which entails the conflict occurrences, date of conflicts, fatalities, types of conflicts, among other factors, we contribute a geo-spatial analytics tool to allow users to visualize the data for South Asian countries and garner insights with respect to conflict occurrences with great user experience. We aim at delivering an R shiny app that first provides a basic understanding of the nature of the armed conflict events, e.g. the different types of armed conflicts, the intensities in different countries in south Asia, and time series analysis to visualize the evolution of the armed conflicts with the impact in terms of fatalities over the period of 2016-2019 in South Asia. Geospatial analysis will be performed to identify the intensity of these armed conflicts in different regions across time through point pattern analysis. Finally, we will further deep-dive into how certain these activities are impacted by space as well as time through spatio-temporal analysis. |
== Project Motivation== | == Project Motivation== | ||
| Line 28: | Line 36: | ||
== Proposed Analytical Methods & Visualisation == | == Proposed Analytical Methods & Visualisation == | ||
| − | |||
| − | |||
| − | |||
| − | |||
| − | |||
| − | |||
| − | |||
| − | |||
| − | |||
| − | |||
| − | |||
| − | |||
| − | |||
| − | |||
| − | |||
| − | |||
| − | |||
| − | |||
| − | |||
| − | |||
| − | |||
| − | |||
| − | |||
| − | |||
| − | |||
| − | |||
| − | |||
| − | |||
| − | |||
| − | |||
| − | |||
| − | |||
| − | |||
| − | |||
| − | |||
| − | |||
| − | |||
| − | |||
| + | {| class="wikitable" | ||
| + | |- | ||
| + | ! Analytics Method !! Storyboard (Wireframe) of Application | ||
| + | |- | ||
| + | | <b> Overview Point Symbol Map: </b> A symbol map will be used to do study the different types of the armed conflicts over different countries in South Asia. The visualization will be enabled with filters for countries as well as the conflict types || | ||
| + | [[File:Point symbol map.jpg|600px|none|Example of point symbol map showing number of events during a certain period.]] | ||
| + | |- | ||
| + | | <b> Slope Chart: </b> Compares the ranking of countries with respect to fatalities and the number of events of armed conflicts in South Asia over time to get a glimpse of the country wise ranking. || | ||
| + | [[File:Slope chart.jpg|600px|none|Example of slope chart.]] | ||
| + | |- | ||
| + | | <b> Calendar Chart: </b> A calendar chart will be used to visualize the intensity of armed conflicts over different periods of time. It can be called as a time series heatmap which can be filtered based on the South Asian countries as well as the different conflict types to narrow down the insights. || | ||
| + | [[File:Calendar chart.jpg|600px|none|Example of calendar chart.]] | ||
| + | |- | ||
| + | | <b> Multi-type Point Pattern Analysis: </b> A multitype point pattern is a marked point pattern in which marks are categorical variables. The armed conflicts data is marked with a number of attributes such as event type (Protests, Riots, etc.) and the parties involved in the conflict (Vigilante Group, Labour Group, LGBT, etc.), and therefore the intent is to investigate whether points with different marked values are segregated, or if there are there any spatial variations in the types of mark. Users will be able to indicate the different marks and mark types which they'd like to include in the analysis, and separate density plots of each marked type will be generated. Additionally, pairs plot will be used to visualise the relationship between the density plots. Ripley's K-function (L-function) will be used to perform multi-distance spatial cluster analysis, which aims to quantify the second-order properties of the observed point processes. The intent of this analysis is to understand how the occurrence of an armed conflict event increases or suppresses the probability of another event nearby. || | ||
| + | [[File:Point pattern 1.jpg|600px|none|Example of KDE]] | ||
| + | [[File:Point pattern 2.jpg|600px|none|Example of K function]] | ||
| + | |- | ||
| + | | <b> Spatio-Temporal Analysis: </b> Spatial Temporal is used to analyse the data across both space and time at the same time. The intent of this analysis is to describe the armed conflicts at a certain location and time. With the help of interactivity in the visualization, the user will be provided with the ability to customize the location and time in the spatial temporal analysis. To establish this analysis, point pattern analysis will be used to study the spatial arrangement of points in a 3 dimensional space. The spatial temporal analysis will be linked to a study region linked to the point pattern analysis. A line chart will be showing the trajectory of events during a chosen period for the chosen country based on selection of filters. || | ||
| + | [[File:Spatio-temporal.jpg|600px|none|Example of spatio-temporal analysis.]] | ||
| + | |- | ||
| + | | <b> Data Exploration </b> Providing the user with the flexibility to explore the dataset and also a new dataset for exploration purposes. As a future scope this new uploaded data file, if matches the schema of the original dataset can be used to refresh the visualizations in the application as per the new dataset. || | ||
| + | [[File:Data explore.jpg|600px|none|Example of data explore.]] | ||
| + | |- | ||
| + | |} | ||
== Project Timeline == | == Project Timeline == | ||
| − | [[File:Gantt Chart screenshot.PNG| | + | [[File:Gantt Chart screenshot.PNG|1000px|none|Screenshot of Gantt Chart (updated on 3/1/2020)]] |
== Data Description == | == Data Description == | ||
| Line 76: | Line 70: | ||
[https://acleddata.com/data-export-tool/ ACLED data] is used for this project that has been extracted from the data gathered by Armed Conflict Location & Event Data Project (ACLED). The data is extracted for a period of 4 years from 1st January 2016 to 31st December 2019, and the area of focus is South Asia (India, Pakistan, Sri Lanka, Nepal and Bangladesh). The dataset consists of 100996 events and is comprehensive with various attributes that can be associated to conflict occurrences and are used for different analyses. Some of the key attributes that shall be considered in the analysis performed in this project are mentioned in the table below. | [https://acleddata.com/data-export-tool/ ACLED data] is used for this project that has been extracted from the data gathered by Armed Conflict Location & Event Data Project (ACLED). The data is extracted for a period of 4 years from 1st January 2016 to 31st December 2019, and the area of focus is South Asia (India, Pakistan, Sri Lanka, Nepal and Bangladesh). The dataset consists of 100996 events and is comprehensive with various attributes that can be associated to conflict occurrences and are used for different analyses. Some of the key attributes that shall be considered in the analysis performed in this project are mentioned in the table below. | ||
| − | {| class="wikitable" | + | {| class="wikitable"" |
|- | |- | ||
! Data Fields !! Description !! Example !! Datatype | ! Data Fields !! Description !! Example !! Datatype | ||
| Line 122: | Line 116: | ||
| '''Shiny()''' || To create interactive web application for the final product | | '''Shiny()''' || To create interactive web application for the final product | ||
|- | |- | ||
| − | | ''' | + | | '''geoshaper()'''|| To create visualizations linked to map in Spatio-temporal analysis |
|} | |} | ||
== References == | == References == | ||
1. https://acleddata.com/#/dashboard <br> | 1. https://acleddata.com/#/dashboard <br> | ||
| − | 2. https:// | + | 2. https://azaieznotesblog.files.wordpress.com/2017/08/spatial-point-patterns_chapman-hall-crc-2016.pdf <br> |
3. https://en.wikipedia.org/wiki/Point_pattern_analysis <br> | 3. https://en.wikipedia.org/wiki/Point_pattern_analysis <br> | ||
4. https://www.omnisci.com/technical-glossary/spatial-temporal <br> | 4. https://www.omnisci.com/technical-glossary/spatial-temporal <br> | ||
| + | 5. https://redoakstrategic.com/geoshaper/ <br> | ||
| + | 5. https://www.r-bloggers.com/quantumplots-with-ggplot2-and-spatstat/ <br> | ||
== Team Members == | == Team Members == | ||
Latest revision as of 19:27, 26 April 2020
|
|
|
|
|
Contents
Overview
In this age of growing socio-political and cultural dissimilarities, the occurrences of armed conflicts have risen. This has been observed especially in nations that are in proximity to each other and those who share borders. Non-profit organizations like ACLED have been collating the data of such conflicts in a tabular form, analyzing such data and mapping the crisis of these events. By leveraging this data, which entails the conflict occurrences, date of conflicts, fatalities, types of conflicts, among other factors, we contribute a geo-spatial analytics tool to allow users to visualize the data for South Asian countries and garner insights with respect to conflict occurrences with great user experience. We aim at delivering an R shiny app that first provides a basic understanding of the nature of the armed conflict events, e.g. the different types of armed conflicts, the intensities in different countries in south Asia, and time series analysis to visualize the evolution of the armed conflicts with the impact in terms of fatalities over the period of 2016-2019 in South Asia. Geospatial analysis will be performed to identify the intensity of these armed conflicts in different regions across time through point pattern analysis. Finally, we will further deep-dive into how certain these activities are impacted by space as well as time through spatio-temporal analysis.
Project Motivation
Our motivation resonates the unrest in South-Asian countries. Armed conflicts in the recent years have become bloodier in South Asia, because of which peace processes could not be sustained for various factors. Initiating such a process is easier than to sustain it. In the last few years, a series of peace processes have been initiated in South Asia in Pakistan, Kashmir, Nepal, India's Northeast and Sri Lanka. The presence of numerous actors, role of civil society, lack of bargaining tools, level of external support, etc play an important role in sustaining the peace processes. Hence, the objective of this project is to highlight some of the armed conflicts in South Asia, and the various factors that play an important role in influencing the occurrence of such events.
Proposed Analytical Methods & Visualisation
| Analytics Method | Storyboard (Wireframe) of Application |
|---|---|
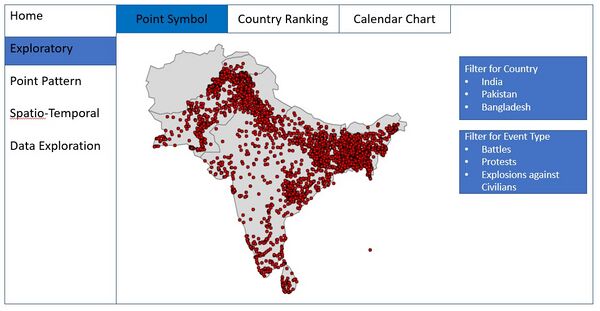
| Overview Point Symbol Map: A symbol map will be used to do study the different types of the armed conflicts over different countries in South Asia. The visualization will be enabled with filters for countries as well as the conflict types | |
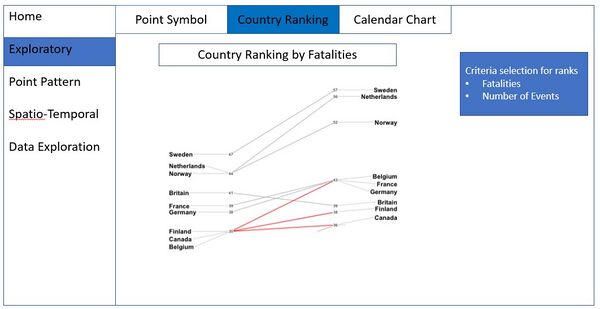
| Slope Chart: Compares the ranking of countries with respect to fatalities and the number of events of armed conflicts in South Asia over time to get a glimpse of the country wise ranking. | |
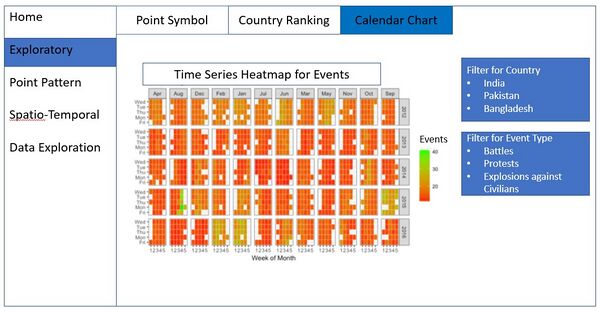
| Calendar Chart: A calendar chart will be used to visualize the intensity of armed conflicts over different periods of time. It can be called as a time series heatmap which can be filtered based on the South Asian countries as well as the different conflict types to narrow down the insights. | |
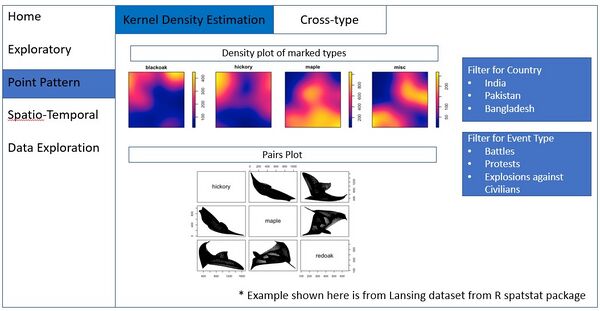
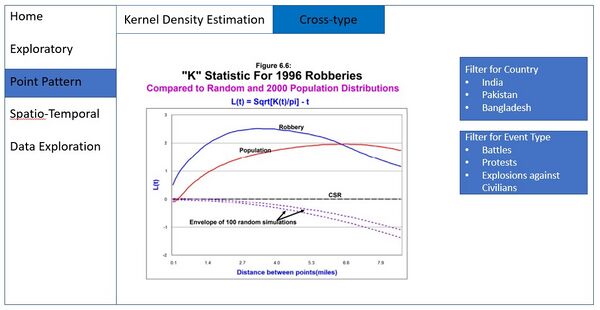
| Multi-type Point Pattern Analysis: A multitype point pattern is a marked point pattern in which marks are categorical variables. The armed conflicts data is marked with a number of attributes such as event type (Protests, Riots, etc.) and the parties involved in the conflict (Vigilante Group, Labour Group, LGBT, etc.), and therefore the intent is to investigate whether points with different marked values are segregated, or if there are there any spatial variations in the types of mark. Users will be able to indicate the different marks and mark types which they'd like to include in the analysis, and separate density plots of each marked type will be generated. Additionally, pairs plot will be used to visualise the relationship between the density plots. Ripley's K-function (L-function) will be used to perform multi-distance spatial cluster analysis, which aims to quantify the second-order properties of the observed point processes. The intent of this analysis is to understand how the occurrence of an armed conflict event increases or suppresses the probability of another event nearby. | |
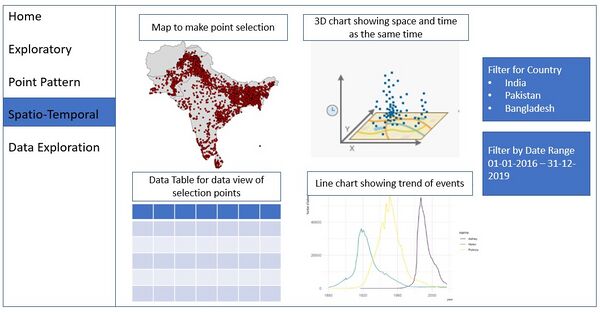
| Spatio-Temporal Analysis: Spatial Temporal is used to analyse the data across both space and time at the same time. The intent of this analysis is to describe the armed conflicts at a certain location and time. With the help of interactivity in the visualization, the user will be provided with the ability to customize the location and time in the spatial temporal analysis. To establish this analysis, point pattern analysis will be used to study the spatial arrangement of points in a 3 dimensional space. The spatial temporal analysis will be linked to a study region linked to the point pattern analysis. A line chart will be showing the trajectory of events during a chosen period for the chosen country based on selection of filters. | |
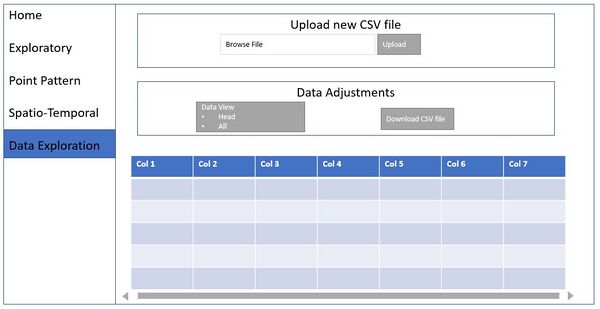
| Data Exploration Providing the user with the flexibility to explore the dataset and also a new dataset for exploration purposes. As a future scope this new uploaded data file, if matches the schema of the original dataset can be used to refresh the visualizations in the application as per the new dataset. |
Project Timeline
Data Description
ACLED Conflict Data
ACLED data is used for this project that has been extracted from the data gathered by Armed Conflict Location & Event Data Project (ACLED). The data is extracted for a period of 4 years from 1st January 2016 to 31st December 2019, and the area of focus is South Asia (India, Pakistan, Sri Lanka, Nepal and Bangladesh). The dataset consists of 100996 events and is comprehensive with various attributes that can be associated to conflict occurrences and are used for different analyses. Some of the key attributes that shall be considered in the analysis performed in this project are mentioned in the table below.
| Data Fields | Description | Example | Datatype |
|---|---|---|---|
| data_id | unique identifier for each event record | 4746257 | Categorical |
| event_date | The day, month and year on which an event took place. | 1-FEB-19 | Date |
| lat | This field records the latitude in decimal degrees. | 30.209423 | Numeric |
| long | This field records the longitude in decimal degrees. | 67.018009 | Numeric |
| event_type | The type of event. | Protests | Categorical |
| country | The country in which the event occurred. | Bangladesh | Categorical |
| fatalities | The number of reported fatalities which occurred during the event. | 0 | Numeric |
Spatial Data
GADM which is the database of Global Administrative Areas (GADM) will be used to extract the geopackages for each of the South Asian countries which will further be used for performing spatial analysis. With the help of the geopackages extracted, geospatial data will be used to convert the spatial data to Special Features data which will further be converted to ppp objects for consumption by the Point pattern and Spatio-temporal analysis.
Software Tools
- RStudio: https://rstudio.com/
Proposed R Packages
| Packages | Purpose |
|---|---|
| tidyverse() | To do data manipulation and exploration with dplyr() etc |
| sp() | To create spatial objects from shape files |
| plotly() | To help with creating visuals for exploratory analysis |
| ggplot2() | To create elegant data visualizations using grammar of graphics |
| leaflet() | To create maps within the application |
| spatstat() | To analyse spatial data |
| Shiny() | To create interactive web application for the final product |
| geoshaper() | To create visualizations linked to map in Spatio-temporal analysis |
References
1. https://acleddata.com/#/dashboard
2. https://azaieznotesblog.files.wordpress.com/2017/08/spatial-point-patterns_chapman-hall-crc-2016.pdf
3. https://en.wikipedia.org/wiki/Point_pattern_analysis
4. https://www.omnisci.com/technical-glossary/spatial-temporal
5. https://redoakstrategic.com/geoshaper/
5. https://www.r-bloggers.com/quantumplots-with-ggplot2-and-spatstat/
Team Members
- Oishee Bhattacharyya
- Jaideep Ballani
- Denise Adele Chua Hui Shan
