Difference between revisions of "Group04 research paper"
Jump to navigation
Jump to search
Yang.xu.2019 (talk | contribs) (Created page with "1100px <font size = 7; color="#0F4C81">CHINA</font><font size = 7; color="#FFB93C"> HAPPINESS </font><font size = 7; color="#0F4C81">SURVEY</fo...") |
Yang.xu.2019 (talk | contribs) |
||
| Line 90: | Line 90: | ||
</td> | </td> | ||
| − | <td width="40%">[[File:MMA | + | <td width="40%">[[File:MMA 5.png|400px|center]]</td> |
| − | <td width="30%">[[File:MMA | + | <td width="30%">[[File:MMA 4.png|300px|center]]</td> |
</tr> | </tr> | ||
| Line 103: | Line 103: | ||
</td> | </td> | ||
<td width="40%">[[File:LB 1.png|400px|center]]</td> | <td width="40%">[[File:LB 1.png|400px|center]]</td> | ||
| − | <td width="30%">[[File:LB | + | <td width="30%">[[File:LB 4.png|300px|center]][[File:LB 3.png|300px|center]]</td> |
</tr> | </tr> | ||
Revision as of 15:21, 26 April 2020
CHINA HAPPINESS SURVEY
|
|
|
|
|
Contents
Project Motivation
Association Rule Mining is Powerful
Room for Improvement of Current Packages
R Packages Used
- For Interactive Application: R Shiny and Shiny Dashboard
Shiny is an R Studio package for developing interactive charts, data visualizations and applications to be hosted on the web using the R programming language. It enables developer to make an interactive application which allow user to understand a certain model or do some data explorations. In this case, we could visualize the underlying rules beyond given datasets which show a clear picture of how those items correlate with each other. Package ‘shiny’Package ‘shinydashboard’
- For Interactive Plot: ggplot2, plotly and gghighlight Package ‘plotly’ Package ‘ggplot2’ Package ‘gghighlight’
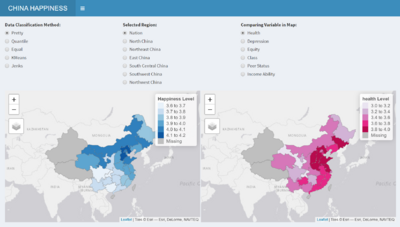
- For Choropleth Mapping: tmap, sf and leaflet Package ‘tmap’Package ‘leaflet’
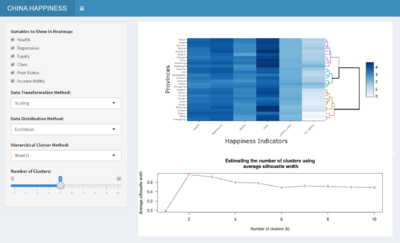
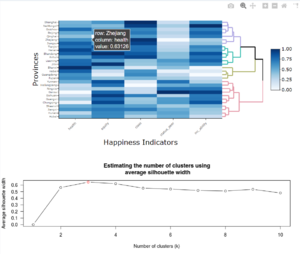
- For HeatMap: heatmaply Package ‘heatmaply’
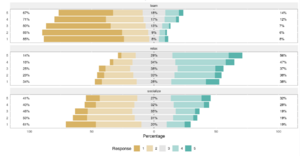
- For Likert Scale: likert Package ‘likert’
- For Correlation Matrix: corrplot Package ‘corrplot’
- For data preparation: sqldf(for SQL operations in R),dplyr,stringr Package ‘sqldf’ Package ‘dplyr’ Package ‘stringr’
Data Cleaning and Preparation
Choice of Visualizations and Critics
Application Design in Details
Use Cases
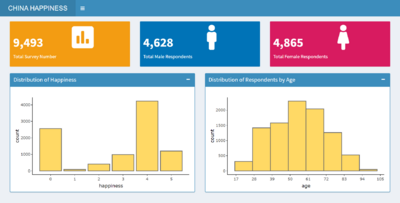
1.Bashboard
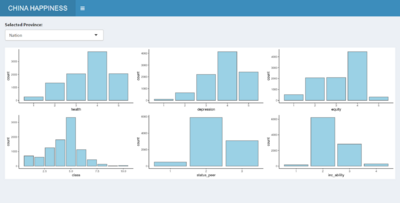
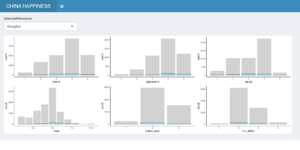
2.Exploratory Data Analysis
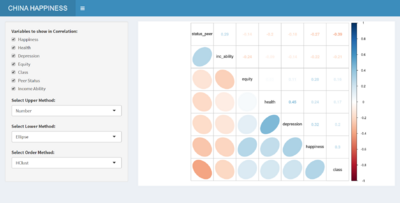
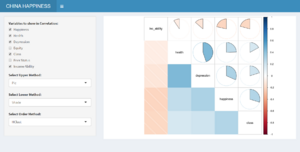
3.Multivariate Matrix Analysis
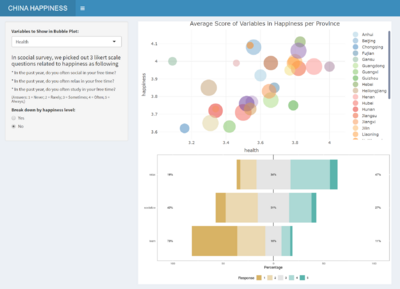
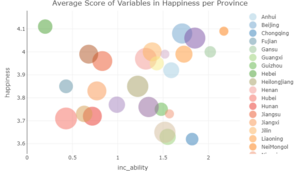
4.Likert & Bubble Plot
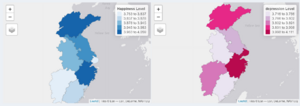
5.Choropleth Mapping
6.Cluster Analysis
References
- World Happiness Report 2020
- Shiny Application layout guide,JJ Allaire
- Event handler R Shiny
- Build your first web app dashboard using Shiny and R
- Enterprise-ready dashboards
- ggplot2 Reference and Examples (Part 2) - Colours
- Hands-On Exercise 8: Diverging Stacked Bar Chart, Dr. Kam Tin Seong
- Hands-on Exercise 8: Heatmap Visualisation with R, Dr. Kam Tin Seong
- Hands-On Exercise 8: Visualising Correlation Matrix, Dr. Kam Tin Seong
- Hands-on Exercise 10: Choropleth Mapping with R, Dr. Kam Tin Seong
- Hands-on Exercise 10: Mapping Geospatial Point Data with R, Dr. Kam Tin Seong

