Difference between revisions of "G4 Report"
Jump to navigation
Jump to search
Yang.xu.2019 (talk | contribs) |
Yang.xu.2019 (talk | contribs) |
||
| (4 intermediate revisions by the same user not shown) | |||
| Line 28: | Line 28: | ||
==Project Motivation== | ==Project Motivation== | ||
| + | <b><big>Association Rule Mining is Powerful</big></b><br> | ||
| + | <b><big>Room for Improvement of Current Packages</big></b><br> | ||
==R Packages Used== | ==R Packages Used== | ||
| + | * For Interactive Application: R Shiny and Shiny Dashboard | ||
| + | Shiny is an R Studio package for developing interactive charts, data visualizations and applications to be hosted on the web using the R programming language. It enables developer to make an interactive application which allow user to understand a certain model or do some data explorations. In this case, we could visualize the underlying rules beyond given datasets which show a clear picture of how those items correlate with each other. [https://cran.r-project.org/web/packages/shiny/shiny.pdf Package ‘shiny’][https://cran.r-project.org/web/packages/shinydashboard/shinydashboard.pdf Package ‘shinydashboard’] | ||
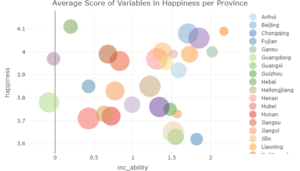
| + | *For Interactive Plot: ggplot2, plotly and gghighlight [https://cran.r-project.org/web/packages/plotly/plotly.pdf Package ‘plotly’] [https://cran.r-project.org/web/packages/ggplot2/ggplot2.pdf Package ‘ggplot2’] [https://cran.r-project.org/web/packages/gghighlight/vignettes/gghighlight.html Package ‘gghighlight’] | ||
| + | |||
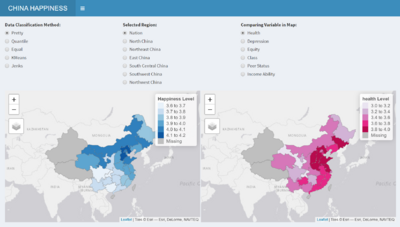
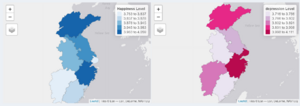
| + | *For Choropleth Mapping: tmap, sf and leaflet [https://cran.r-project.org/web/packages/tmap/vignettes/tmap-getstarted.html Package ‘tmap’][https://rstudio.github.io/leaflet/ Package ‘leaflet’] | ||
| + | |||
| + | *For HeatMap: heatmaply [https://cran.r-project.org/web/packages/heatmaply/heatmaply.pdf Package ‘heatmaply’] | ||
| + | |||
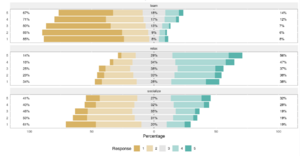
| + | *For Likert Scale: likert [https://rdrr.io/cran/likert/man/shinyLikert.html Package ‘likert’] | ||
| + | |||
| + | *For Correlation Matrix: corrplot [https://cran.r-project.org/web/packages/corrplot/vignettes/corrplot-intro.html Package ‘corrplot’] | ||
| + | |||
| + | *For data preparation: sqldf(for SQL operations in R),dplyr,stringr [https://cran.r-project.org/web/packages/sqldf/sqldf.pdf Package ‘sqldf’] [https://cran.r-project.org/web/packages/dplyr/dplyr.pdf Package ‘dplyr’] [https://cran.r-project.org/web/packages/stringr/stringr.pdf Package ‘stringr’] | ||
| + | |||
| + | ==Data Cleaning and Preparation== | ||
| + | |||
| + | <h4>Datasets</h4> | ||
| + | * happiness_train_abbr: lite version of survey dataset | ||
| + | * happiness_train_complete: full version of survey dataset | ||
| + | * happiness_index: index and description of survey dataset | ||
| + | |||
| + | <h4>Index and Description - happiness_train_abbr</h4> | ||
| + | <div> | ||
| + | |||
| + | <table style="border: 1px solid #dddddd; font-size:10px;"> | ||
| + | <tr style="border: 1px solid #dddddd;background-color: #eeeeee; padding: 2px; font-size:11px;"><th width="12.5%"> Data field </th><th width="7.5%"> Original questionnaire number </th><th width="20%"> Question </th><th width="60%"> Remarks </th></tr> | ||
| + | <tr style="border: 1px solid #dddddd;padding: 2px;"><td><b> id </b></td><td> - </td><td> ID </td><td> - </td></tr> | ||
| + | <tr style="border: 1px solid #dddddd;padding: 2px;"><td><b> province </b></td><td> s41 </td><td> Survey Location - Province/Autonomous Region/Municipality </td><td> 1 = Shanghai; 2 = Yunnan Province; 3 = Inner Mongolia Autonomous Region; 4 = Beijing; 5 = Jilin Province; 6 = Sichuan Province; 7 = Tianjin; 8 = Ningxia Hui Autonomous Region; 9 = Anhui Province; 10 = Shandong Province ; 11 = Shanxi Province; 12 = Guangdong Province; 13 = Guangxi Zhuang Autonomous Region; 14 = Xinjiang Uygur Autonomous Region; 15 = Jiangsu Province; 16 = Jiangxi Province; 17 = Hebei Province; 18 = Henan Province; 19 = Zhejiang Province; 20 = Hainan Province; 21 = Hubei Province; 22 = Hunan Province; 23 = Gansu Province; 24 = Fujian Province; 25 = Tibet Autonomous Region; 26 = Guizhou Province; 27 = Liaoning Province; 28 = Chongqing City; 29 = Shaanxi Province; 30 = Qinghai Province; 31 = Heilongjiang Province; </td></tr> | ||
| + | <tr style="border: 1px solid #dddddd;padding: 2px;"><td><b> gender </b></td><td> a2 </td><td> Gender </td><td> 1 = Male; 2 = Female </td></tr> | ||
| + | <tr style="border: 1px solid #dddddd;background-color: #eeeeee;padding: 2px;"><td><b> birth </b></td><td> a301 </td><td> Birthday </td><td> - </td></tr> | ||
| + | <tr style="border: 1px solid #dddddd;background-color: #eeeeee;padding: 2px;"><td><b> health </b></td><td> a15 </td><td> Do you feel your current physical health </td><td> 1 = Unhealthy; 2 = Less healthy; 3 = Fair; 4 = healthy; 5 = Very Healthy; </td></tr> | ||
| + | <tr style="border: 1px solid #dddddd;background-color: #eeeeee;padding: 2px;"><td><b> depression </b></td><td> a17 </td><td> How often you feel depressed or depressed in the past four weeks </td><td> 1 = Always; 2 = Often; 3 = Sometimes; 4 = Rarely; 5 = Never; </td></tr> | ||
| + | <tr style="border: 1px solid #dddddd;padding: 2px;"><td><b> relax </b></td><td> a312 </td><td> In the past year, do you often do the following in your free time-relax </td><td> 1 = Never; 2 = Rarely; 3 = Sometimes; 4 = Often; 5 = Always; </td></tr> | ||
| + | <tr style="border: 1px solid #dddddd;background-color: #eeeeee;padding: 2px;"><td><b> learn </b></td><td> a313 </td><td> In the past year, do you often do the following in your free time-study </td><td> 1 = Never; 2 = Rarely; 3 = Sometimes; 4 = Often; 5 = Always; </td></tr> | ||
| + | <tr style="border: 1px solid #dddddd;padding: 2px;"><td><b> equity </b></td><td> a35 </td><td> Generally speaking, do you think society is unfair today? </td><td> 1 = Completely unfair; 2 = More unfair; 3 = Not fair but not unfair; 4 = More fair; 5 = Completely fair; </td></tr> | ||
| + | <tr style="border: 1px solid #dddddd;background-color: #eeeeee;padding: 2px;"><td><b> happiness </b></td><td> a36 </td><td> Overall, do you think your life is happy </td><td> 1 = Very unhappy; 2 = Relatively unhappy; 3 = Not happy or unhappy; 4 = Relatively happy; 5 = Very happy; </td></tr> | ||
| + | <tr style="border: 1px solid #dddddd;padding: 2px;"><td><b> class </b></td><td> a431 </td><td> At what level do you think you are currently </td><td> 1 = 1(bottom); 10 = 10(top); </td></tr> | ||
| + | <tr style="border: 1px solid #dddddd;padding: 2px;"><td><b> status_peer </b></td><td> b1 </td><td> What is your socioeconomic status compared to your peers </td><td> 1 = Higher; 2 = Almost; 3 = Lower; </td></tr> | ||
| + | <tr style="border: 1px solid #dddddd;background-color: #eeeeee;padding: 2px;"><td><b> inc_ability </b></td><td> b5 </td><td> Considering your ability and working conditions, is your current income reasonable? </td><td> 1 = Very reasonable; 2 = Reasonable; 3 = Unreasonable; 4 = Very unreasonable; </td></tr> | ||
| + | </table> | ||
| + | |||
| + | </div> | ||
==Choice of Visualizations and Critics== | ==Choice of Visualizations and Critics== | ||
| Line 116: | Line 160: | ||
==References== | ==References== | ||
| − | + | *[https://worldhappiness.report/ World Happiness Report 2020] | |
| − | |||
| − | |||
| − | |||
| − | *[https:// | ||
*[https://shiny.rstudio.com/articles/layout-guide.html Shiny Application layout guide,JJ Allaire] | *[https://shiny.rstudio.com/articles/layout-guide.html Shiny Application layout guide,JJ Allaire] | ||
| − | |||
| − | |||
| − | |||
| − | |||
| − | |||
| − | |||
*[https://shiny.rstudio.com/reference/shiny/latest/observeEvent.html Event handler R Shiny] | *[https://shiny.rstudio.com/reference/shiny/latest/observeEvent.html Event handler R Shiny] | ||
| − | *[https:// | + | *[https://https://www.freecodecamp.org/news/build-your-first-web-app-dashboard-using-shiny-and-r-ec433c9f3f6c/ Build your first web app dashboard using Shiny and R] |
| − | *[https:// | + | *[https://db.rstudio.com/best-practices/dashboards/ Enterprise-ready dashboards] |
| + | *[http://rstudio-pubs-static.s3.amazonaws.com/5312_98fc1aba2d5740dd849a5ab797cc2c8d.html ggplot2 Reference and Examples (Part 2) - Colours] | ||
| + | *[https://rpubs.com/tskam/likert Hands-On Exercise 8: Diverging Stacked Bar Chart, Dr. Kam Tin Seong] | ||
| + | *[https://rpubs.com/tskam/heatmaps Hands-on Exercise 8: Heatmap Visualisation with R, Dr. Kam Tin Seong] | ||
| + | *[https://rpubs.com/tskam/Corrgram Hands-On Exercise 8: Visualising Correlation Matrix, Dr. Kam Tin Seong] | ||
| + | *[https://rpubs.com/tskam/Choropleth_Mapping Hands-on Exercise 10: Choropleth Mapping with R, Dr. Kam Tin Seong] | ||
| + | *[https://rpubs.com/tskam/Proportional_Symbol_Map Hands-on Exercise 10: Mapping Geospatial Point Data with R, Dr. Kam Tin Seong] | ||
Latest revision as of 16:50, 25 April 2020
CHINA HAPPINESS SURVEY
|
|
|
|
|
Contents
Project Motivation
Association Rule Mining is Powerful
Room for Improvement of Current Packages
R Packages Used
- For Interactive Application: R Shiny and Shiny Dashboard
Shiny is an R Studio package for developing interactive charts, data visualizations and applications to be hosted on the web using the R programming language. It enables developer to make an interactive application which allow user to understand a certain model or do some data explorations. In this case, we could visualize the underlying rules beyond given datasets which show a clear picture of how those items correlate with each other. Package ‘shiny’Package ‘shinydashboard’
- For Interactive Plot: ggplot2, plotly and gghighlight Package ‘plotly’ Package ‘ggplot2’ Package ‘gghighlight’
- For Choropleth Mapping: tmap, sf and leaflet Package ‘tmap’Package ‘leaflet’
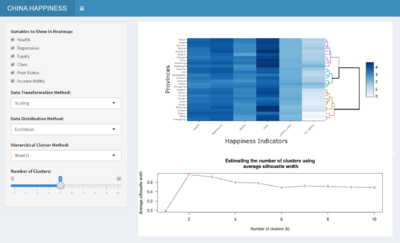
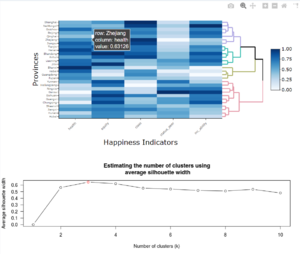
- For HeatMap: heatmaply Package ‘heatmaply’
- For Likert Scale: likert Package ‘likert’
- For Correlation Matrix: corrplot Package ‘corrplot’
- For data preparation: sqldf(for SQL operations in R),dplyr,stringr Package ‘sqldf’ Package ‘dplyr’ Package ‘stringr’
Data Cleaning and Preparation
Datasets
- happiness_train_abbr: lite version of survey dataset
- happiness_train_complete: full version of survey dataset
- happiness_index: index and description of survey dataset
Index and Description - happiness_train_abbr
| Data field | Original questionnaire number | Question | Remarks |
|---|---|---|---|
| id | - | ID | - |
| province | s41 | Survey Location - Province/Autonomous Region/Municipality | 1 = Shanghai; 2 = Yunnan Province; 3 = Inner Mongolia Autonomous Region; 4 = Beijing; 5 = Jilin Province; 6 = Sichuan Province; 7 = Tianjin; 8 = Ningxia Hui Autonomous Region; 9 = Anhui Province; 10 = Shandong Province ; 11 = Shanxi Province; 12 = Guangdong Province; 13 = Guangxi Zhuang Autonomous Region; 14 = Xinjiang Uygur Autonomous Region; 15 = Jiangsu Province; 16 = Jiangxi Province; 17 = Hebei Province; 18 = Henan Province; 19 = Zhejiang Province; 20 = Hainan Province; 21 = Hubei Province; 22 = Hunan Province; 23 = Gansu Province; 24 = Fujian Province; 25 = Tibet Autonomous Region; 26 = Guizhou Province; 27 = Liaoning Province; 28 = Chongqing City; 29 = Shaanxi Province; 30 = Qinghai Province; 31 = Heilongjiang Province; |
| gender | a2 | Gender | 1 = Male; 2 = Female |
| birth | a301 | Birthday | - |
| health | a15 | Do you feel your current physical health | 1 = Unhealthy; 2 = Less healthy; 3 = Fair; 4 = healthy; 5 = Very Healthy; |
| depression | a17 | How often you feel depressed or depressed in the past four weeks | 1 = Always; 2 = Often; 3 = Sometimes; 4 = Rarely; 5 = Never; |
| relax | a312 | In the past year, do you often do the following in your free time-relax | 1 = Never; 2 = Rarely; 3 = Sometimes; 4 = Often; 5 = Always; |
| learn | a313 | In the past year, do you often do the following in your free time-study | 1 = Never; 2 = Rarely; 3 = Sometimes; 4 = Often; 5 = Always; |
| equity | a35 | Generally speaking, do you think society is unfair today? | 1 = Completely unfair; 2 = More unfair; 3 = Not fair but not unfair; 4 = More fair; 5 = Completely fair; |
| happiness | a36 | Overall, do you think your life is happy | 1 = Very unhappy; 2 = Relatively unhappy; 3 = Not happy or unhappy; 4 = Relatively happy; 5 = Very happy; |
| class | a431 | At what level do you think you are currently | 1 = 1(bottom); 10 = 10(top); |
| status_peer | b1 | What is your socioeconomic status compared to your peers | 1 = Higher; 2 = Almost; 3 = Lower; |
| inc_ability | b5 | Considering your ability and working conditions, is your current income reasonable? | 1 = Very reasonable; 2 = Reasonable; 3 = Unreasonable; 4 = Very unreasonable; |
Choice of Visualizations and Critics
Application Design in Details
Use Cases
1.Bashboard
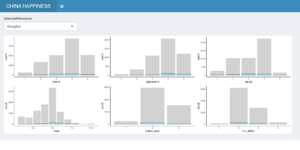
2.Exploratory Data Analysis
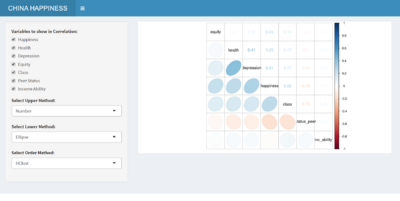
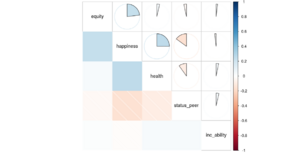
3.Multivariate Matrix Analysis
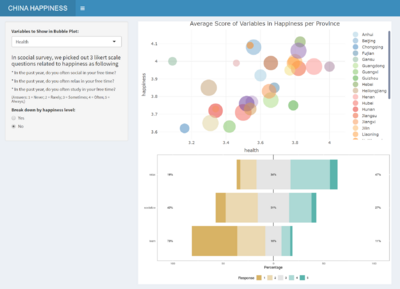
4.Likert & Bubble Plot
5.Choropleth Mapping
6.Cluster Analysis
References
- World Happiness Report 2020
- Shiny Application layout guide,JJ Allaire
- Event handler R Shiny
- Build your first web app dashboard using Shiny and R
- Enterprise-ready dashboards
- ggplot2 Reference and Examples (Part 2) - Colours
- Hands-On Exercise 8: Diverging Stacked Bar Chart, Dr. Kam Tin Seong
- Hands-on Exercise 8: Heatmap Visualisation with R, Dr. Kam Tin Seong
- Hands-On Exercise 8: Visualising Correlation Matrix, Dr. Kam Tin Seong
- Hands-on Exercise 10: Choropleth Mapping with R, Dr. Kam Tin Seong
- Hands-on Exercise 10: Mapping Geospatial Point Data with R, Dr. Kam Tin Seong

