Difference between revisions of "G4 Report"
Jump to navigation
Jump to search
Yang.xu.2019 (talk | contribs) |
Yang.xu.2019 (talk | contribs) |
||
| Line 96: | Line 96: | ||
</td> | </td> | ||
| − | + | <td width="40%">[[File:Map 1.png|400px|center]]</td> | |
| − | <td width="40%">[[File: | + | <td width="30%">[[File:Map 2.png|300px|center]]</td> |
| − | <td width="30%">[[File: | ||
</tr> | </tr> | ||
| Line 106: | Line 105: | ||
<table border='1' width="100%"> | <table border='1' width="100%"> | ||
<tr> | <tr> | ||
| − | <td width=" | + | <td width="30%"> |
</td> | </td> | ||
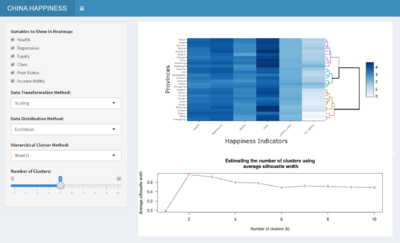
| − | <td width=" | + | <td width="40%">[[File:Heat 1.png|400px|center]]</td> |
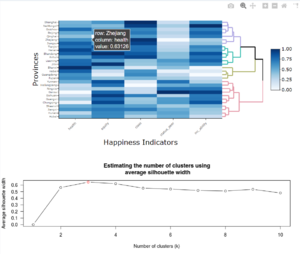
| − | <td width=" | + | <td width="30%">[[File:Heat 2.png|300px|center]]</td> |
</tr> | </tr> | ||
Revision as of 16:09, 25 April 2020
CHINA HAPPINESS SURVEY
|
|
|
|
|
Contents
Project Motivation
R Packages Used
Choice of Visualizations and Critics
Application Design in Details
Use Cases
1.Bashboard
2.Exploratory Data Analysis
3.Multivariate Matrix Analysis
4.Likert & Bubble Plot
5.Choropleth Mapping
6.Cluster Analysis
References
- visNetwork, an R package for interactive network visualization
- Association Rules and the Apriori Algorithm: A Tutorial,Annalyn Ng, Ministry of Defence of Singapore
- Association Rule Mining with R,Yanchang Zhao
- Market basket analysis,S. Bushmanov
- Market Basket Analysis Using R and Shiny, Maureen O'Donnell
- Shiny Application layout guide,JJ Allaire
- Zoomable plots in Shiny, RStudio, Inc.
- Introduction to visNetwork,B. Thieurmel - DataStorm
- Interactive arules with arulesViz and visNetwork,timelyportfolio
- Network visualization with R Workshop,Katya Ognyanova
- Selecting rows of data R Shiny
- Write Transactions or Associations to a File
- Event handler R Shiny
- Using Action Buttons R Shiny
- Create an object for storing reactive values R Shiny

