Difference between revisions of "Group16 proposal"
Ying.li.2019 (talk | contribs) |
Ying.li.2019 (talk | contribs) |
||
| Line 63: | Line 63: | ||
==Data Resources== | ==Data Resources== | ||
| − | 1. Meat worldwide trade dataset (link: https://resourcetrade.earth/about) | + | 1. '''Meat worldwide trade dataset''' (link: https://resourcetrade.earth/about) |
The meat trade data used in this project is collected and manipulated by website resourcetrade.earth (https://resourcetrade.earth/about#section-16). The original data is from Chatham House Resource Trade Database (CHRTD) which is a repository of bilateral trade in natural resources between more than 200 countries and territories. The database includes the monetary values and masses of trade in over 1,350 different types of natural resources and resource products, including agricultural, fishery and forestry products, fossil fuels, metals and other minerals, and pearls and gemstones. It contains raw materials, intermediate products, and by-products. In this project we just focus on the meat trade. | The meat trade data used in this project is collected and manipulated by website resourcetrade.earth (https://resourcetrade.earth/about#section-16). The original data is from Chatham House Resource Trade Database (CHRTD) which is a repository of bilateral trade in natural resources between more than 200 countries and territories. The database includes the monetary values and masses of trade in over 1,350 different types of natural resources and resource products, including agricultural, fishery and forestry products, fossil fuels, metals and other minerals, and pearls and gemstones. It contains raw materials, intermediate products, and by-products. In this project we just focus on the meat trade. | ||
| Line 84: | Line 84: | ||
|} | |} | ||
| − | 2. Meat consumption and production dataset (link: ??) | + | 2. '''Meat consumption and production dataset''' (link: ??) |
{| class="wikitable" | {| class="wikitable" | ||
|- | |- | ||
Revision as of 22:22, 9 April 2020
Project Motivations
In recent decades, humans step into the gold time of human history. We have seen rising internet technology, growing digital society and updating infrastructure. But if we pull back our sights to real daily life and onto the diet table, what is the change? For our team members(Chinese after the '90s), more meat. Today we can enjoy meat in different types of situations and have our own, very personal preferences. From our first thought, more meat consumption seems common for the whole world.
Brazil, Russia, India, China, and South Africa – the BRICS – are five big developing countries that are setting out from different starting points. They may not end up with the food consumption patterns of the industrialized West but it is undeniable that they together account for 40% of the world's population. The data shows that between 2003 and 2012, their meat consumption rose by 6.3 percent a year and it is expected to rise by another 2.5 percent a year between 2013 and 2022. Also, the demand for meat in the developed world has also peaked.
But will this trend continue(meat consumption grows), until when everyone in the world can enjoy as much meat as they wish? Maybe not.
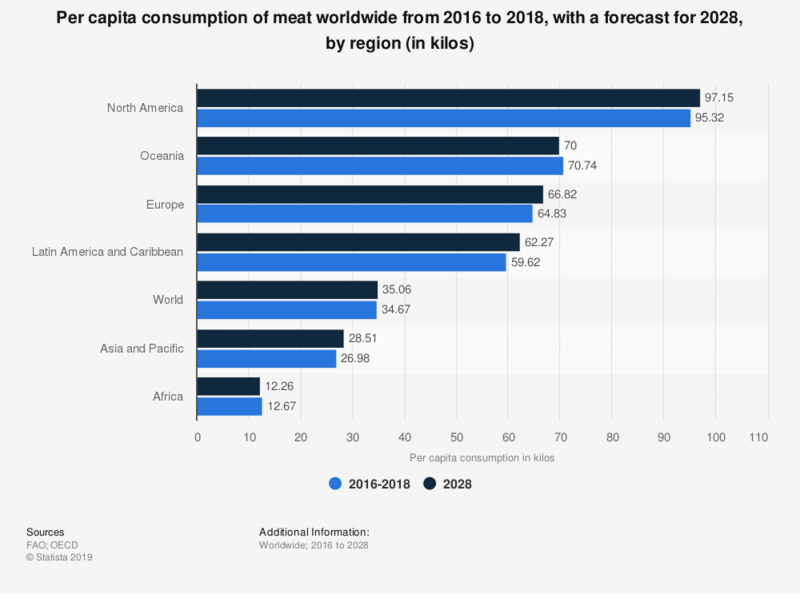
The above figure just plotted the meat consumption per capita, both actual recent data and projected data. Although FAO considered many factors to forecast future meat consumption, the interesting thing is that future meat consumption per capita may not exceed today. Actually, this cannot be fully explained by reason like the healthy diet style with balanced food types. Because in regions such as Africa and Asia, people still eat meat at a low level.
Since meat consumption will not grow steadily as we think. The following question is what limits meat consumption to a certain level?
Motivated by this question and hoping to explain it, our team wishes to investigate the meat market, from production, consumption, to global trade inclusive.
Reviews on past work
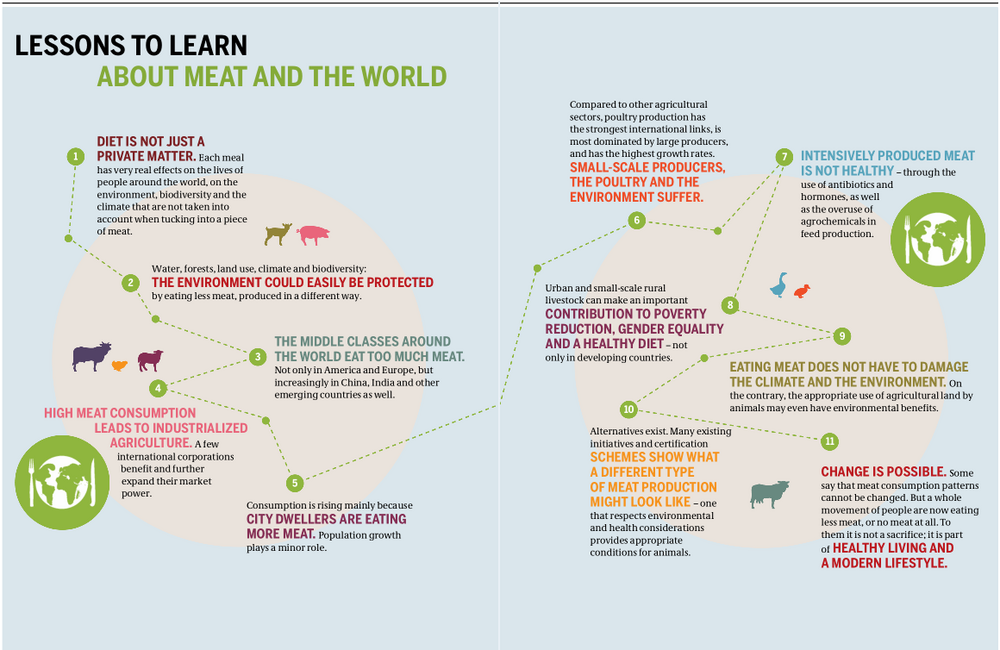
A highly recommended work is Meat Altas(*Der Fleischatlas* in German)[1], a publication by the Heinrich Boell Foundation - a German environmental NGO - and Friends of the Earth Europe. Consisting of 27 short essays by different authors, the report aims to inform consumers about the impact of meat consumption on global poverty, climate change, animal welfare, biodiversity, and the migration of workers.
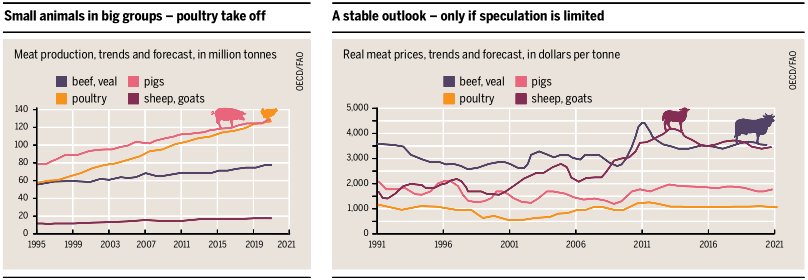
The book shows a full image via small stories with internal links. In the report, charts are attractive, giving insights to normal consumers that they hardly see in the food package.
Though inspired by the authors' work and goal, we have to point out two weaknesses from the view of data analysts:
- Most charts are in the same type of the above graph. They are successful in terms of story-telling visualization. However, some elements like the grid-line, background-color, and extended x-axis appear redundant while the distinguishment between the recent trend and the future forecast is missing.
- All conclusions are drawn by descriptive statistics and most of them are only qualitative. Surely we can test a conclusion to make it more convincing. More importantly, we can try to apply the time series analysis on meat production and consumption. If possible, a mathematical model can be built to conduct a sensitivity analysis and see how a change in the meat consumption amount will affect our world.
Data Resources
1. Meat worldwide trade dataset (link: https://resourcetrade.earth/about)
The meat trade data used in this project is collected and manipulated by website resourcetrade.earth (https://resourcetrade.earth/about#section-16). The original data is from Chatham House Resource Trade Database (CHRTD) which is a repository of bilateral trade in natural resources between more than 200 countries and territories. The database includes the monetary values and masses of trade in over 1,350 different types of natural resources and resource products, including agricultural, fishery and forestry products, fossil fuels, metals and other minerals, and pearls and gemstones. It contains raw materials, intermediate products, and by-products. In this project we just focus on the meat trade. This dataset covers the meat bilateral trade between nearly 250 countries and territories from 2001 to 2018, and there are 220194 rows of data.
| Variable | Description |
|---|---|
| Exporter information | Provides the information about the exporter country, which includes M.49 number, ISO3 code, country name and the region belongs to. |
| Importer information | Provides the information about the importer country, which includes M.49 number, ISO3 code, country name and the region belongs to. |
| Resourse | The categories of meat including beef, pork, poultry, sheep meat and meat of other animals. |
| Year | The year of the trades (from 2001 to 2018). |
| Value | Monetary value of trade amount in 1000 USD. |
| Weight | Weight value of trade amount in 1000 kilograms. |
2. Meat consumption and production dataset (link: ??)
| Variable | Description |
|---|---|
| Country information | Provides the information about the countries, which includes ISO3 code, country name and the continent belongs to. |
| Item | The categories of meat including beef, pork, poultry, sheep meat and meat of other animals. |
| Year | The year of the trades (from 2001 to 2018). |
| Unit | Two units of consumption and production amount, THND_TONNE(thousand tonnes) and KG_CAP(kilogram per capita). |
| Consumption | The amount of meat consumed. |
| Production | The amount of meat produced. |
Methodology
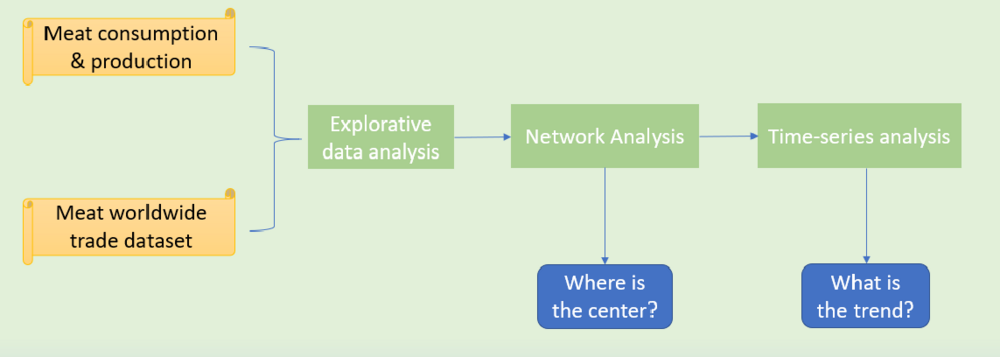
- Explorative data analysis: It can reveal a time trend or a geographical pattern of meat production and consumption.
- Multi-dimensional analysis: It can test or may confirm the relationship between meat and multiple social and environmental factors.
- Time series analysis: It will be used to predict the future trend of the consumption and production of meat.
