Difference between revisions of "Group16 proposal"
Yu.gao.2019 (talk | contribs) |
Yu.gao.2019 (talk | contribs) |
||
| Line 1: | Line 1: | ||
| + | </div> | ||
| + | <!--MAIN HEADER --> | ||
| + | <div style="background-color:#e0f3db; text-align:center"> | ||
| + | <font size = 5; color = #212d41><span style="font-family:Helvetica;"><b>Think before we eat meat</b><br></span></font> | ||
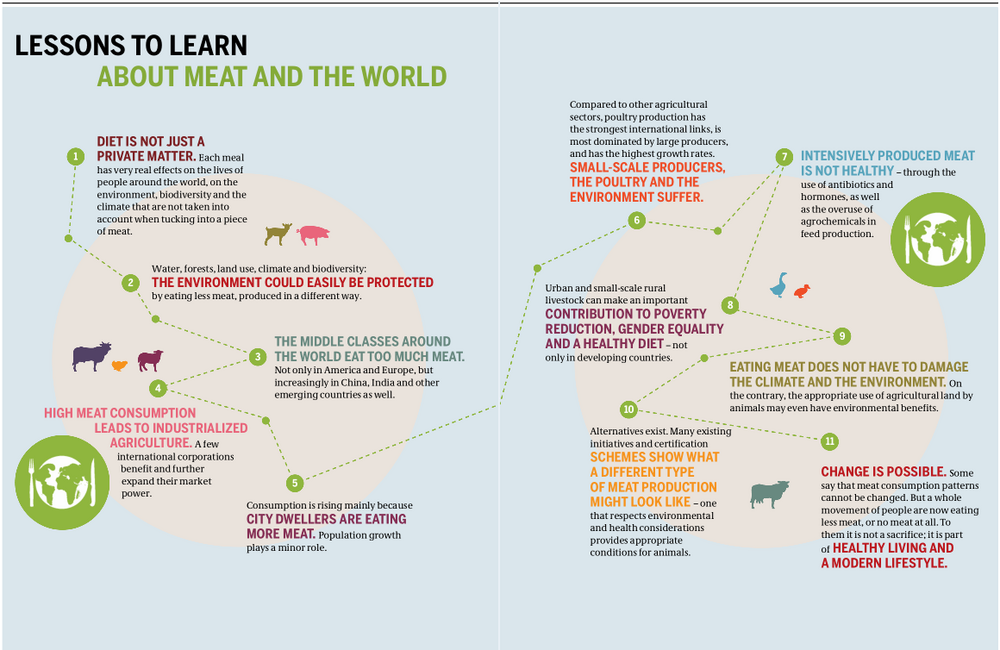
[[File:Meat and the world.png|1000px|frameless|center]] | [[File:Meat and the world.png|1000px|frameless|center]] | ||
| + | </div> | ||
| + | |||
<div> | <div> | ||
{|style="background-color:#575050;" width="100%" cellspacing="0" cellpadding="0" valign="top" border="0" | | {|style="background-color:#575050;" width="100%" cellspacing="0" cellpadding="0" valign="top" border="0" | | ||
| style="font-family:Century Gothic; font-size:100%; solid #c0c0c0; background:#bfbbbb; text-align:center;" width="25%" | | | style="font-family:Century Gothic; font-size:100%; solid #c0c0c0; background:#bfbbbb; text-align:center;" width="25%" | | ||
; | ; | ||
| − | [[Group16_proposal | + | [[Group16_proposal| <font color="#141313">Proposal</font>]] |
| style="font-family:Century Gothic; font-size:100%; solid #103080; background:#bfbbbb; text-align:center;" width="25%" | | | style="font-family:Century Gothic; font-size:100%; solid #103080; background:#bfbbbb; text-align:center;" width="25%" | | ||
Revision as of 17:32, 29 March 2020
Project Motivations
Three of our team members are all meat lovers. As the generation growing after the reform and opening of China and in a globalized world, we all know that our parents experienced an era when meat was so rare that they could not buy it without a meat ticket whilst now we can enjoy meat every meal as we wish. This is the achievement of China, and it has also happened to many parts of our world. Since the latest decades were golden years in human history. Brazil, Russia, India, China, and South Africa – the BRICS – are five big developing countries that are setting out from different starting points. They may not end up with the food consumption patterns of the industrialized West. The demand for meat in the developed world has also peaked.
Today we can enjoy meat in different types of situations and have our own, very personal preferences. At the same time, however, we are more and more alienated from what is on our plates, on the table, and in our hands. Each of us ought to decide what we want to eat. How can normal consumers understand the global impact caused by their meat consumption? How many people realize that our demand for meat is directly responsible for clearing the Amazon rainforest? Who is aware of the consequences of industrial livestock production for poverty and hunger, displacement and migration, animal welfare, or on climate change and biodiversity? Responsible consumption is something that an increasing number of people demand. Then again, we need information on which to base our decisions.
Motivated by the above facts, our team wishes to investigate how the meat is linked to the social, economic and environmental factors, visualize the relationship and use analytics to reveal some facts that we must know before we eat.
Reviews on past work
A highly recommended work is Meat Altas(*Der Fleischatlas* in German), a publication by the Heinrich Boell Foundation - a German environmental NGO - and a called "Friends of the Earth". Consisting of 27 short essays by different authors, the report aims to inform consumers about the impact of meat consumption on global poverty, climate change, animal welfare, biodiversity, and the migration of workers.
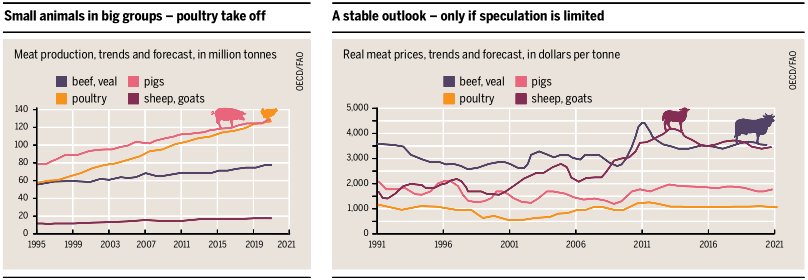
The book shows a full image via small stories with internal links. In the report, charts are attractive, giving insights to normal consumers that they hardly see in the food package.
Though inspired by the authors' work and goal, we have to point out two weaknesses from the view of data analysts:
- Most charts are in the same type of the above graph. They are successful in terms of story-telling visualization. However, some elements like the grid-line, background-color, and extended x-axis appear redundant while the distinguishment between the recent trend and the future forecast is missing.
- All conclusions are drawn by descriptive statistics and most of them are only qualitative. Surely we can test a conclusion to make it more convincing. More importantly, we can try to apply the time series analysis on meat production and consumption. If possible, a mathematical model can be built to conduct a sensitivity analysis and see how a change in the meat consumption amount will affect our world.
Data source
The core data is about meat consumption and production, which can be found in FAO and OECD.


