Difference between revisions of "Group17 proposal"
Oisheeb.2019 (talk | contribs) |
Oisheeb.2019 (talk | contribs) |
||
| Line 59: | Line 59: | ||
== Data Description == | == Data Description == | ||
| − | + | [https://acleddata.com/data-export-tool/ ACLED data] are derived from a wide range of local, regional and national sources and the information is collected by trained data experts worldwide. An updated overview of ACLED’s current coverage is available on the ACLED website. ACLED data are available to the public and are released in real-time. Data can be downloaded through the data export tool on the ACLED website or can be accessed through the API(a manual is available online). Curated data files– such as regional data files, or aggregate country-year files– can also be accessed online on the ACLED website. | |
{| class="wikitable" style="width: 100%; height: 14em;" | {| class="wikitable" style="width: 100%; height: 14em;" | ||
| Line 65: | Line 65: | ||
! Data Fields !! Description !! Example !! Datatype | ! Data Fields !! Description !! Example !! Datatype | ||
|- | |- | ||
| − | | | + | | iso || A numeric code for each individual country. || 50 || Numeric |
|- | |- | ||
| − | | | + | | event_id_cnty || An individual identifier by number and country acronym(updated annually). || BGD17280 || Text |
|- | |- | ||
| − | | | + | | event_id_no_cnty || An individual numeric identifier(updated annually). || 17280 || Numeric |
|- | |- | ||
| − | | | + | | event_date || The day, month and year on which an event took place. || 1-FEB-20 || Date |
|- | |- | ||
| lat || This field records the latitude in decimal degrees. || 30.209423 || Numeric | | lat || This field records the latitude in decimal degrees. || 30.209423 || Numeric | ||
| Line 77: | Line 77: | ||
| long || This field records the longitude in decimal degrees. || 67.018009 || Numeric | | long || This field records the longitude in decimal degrees. || 67.018009 || Numeric | ||
|- | |- | ||
| − | | | + | | year || The year in which the event took place. || 2020 || Numeric |
|- | |- | ||
| − | | | + | | time_precision || A numeric code indicating the level of certainty of the date coded for the event. || 1 || Numeric |
|- | |- | ||
| − | | | + | | event_type || The type of event. || Protests || Categorical |
|- | |- | ||
| − | | country || | + | | country || The country in which the event occurred. || Bangladesh || Categorical |
|- | |- | ||
| − | | | + | | sub_event_type|| The type of sub_event. || Peaceful protest || Categorical |
|- | |- | ||
| − | | | + | | actor1 || The named actor involved in the event. || Protesters (Bangladesh) || Categorical |
|- | |- | ||
| − | | | + | | assoc_actor_1 || The named actor associated with or identifying ACTOR1. || JSD: Jatiya Samajtantrik Dal || Categorical |
|- | |- | ||
| − | | | + | | inter1 || A numeric code indicating the type of ACTOR1. || 6 || Numeric |
|- | |- | ||
| − | | | + | | actor2 || The named actor involved in the event. || Civilians (Pakistan) || Categorical |
|- | |- | ||
| − | | | + | | assoc_actor_2 || The named actor associated with or identifying ACTOR2. || BNP: Bangladesh Nationalist Party || Categorical |
|- | |- | ||
| − | | | + | | inter2 || A numeric code indicating the type of ACTOR2. || 7 || Numeric |
| + | |- | ||
| + | | interaction || A numeric code indicating the interaction between types of ACTOR1 and ACTOR2. || 67 || Numeric | ||
| + | |- | ||
| + | | region || The region of the world where the event took place. || Southern Asia || Categorical | ||
| + | |- | ||
| + | | admin1 || The largest sub-national administrative region in which the event took place. || Barisal || Categorical | ||
| + | |- | ||
| + | | admin2 || The second-largest sub-national administrative region in which the event took place. || Barisal || Categorical | ||
| + | |- | ||
| + | | admin3 || The third-largest sub-national administrative region in which the event took place. || Barisal || Categorical | ||
| + | |- | ||
| + | | location || The location in which the event took place. || Barisal || Categorical | ||
| + | |- | ||
| + | | geo_precision || A numeric code indicating the level of certainty of the location coded for the event. || 1 || Numeric | ||
| + | |- | ||
| + | | source || The source of the event report. || Daily Star(Bangladesh). || Categorical | ||
| + | |- | ||
| + | | source_scale || The scale(local, regional, national, international) of the source. || National || Categorical | ||
| + | |- | ||
| + | | fatalities || The number of reported fatalities which occurred during the event. || 0 || Numeric | ||
|- | |- | ||
|} | |} | ||
Revision as of 10:06, 2 March 2020
Contents
Overview
Middle East Respiratory Syndrome Coronavirus (MERS-CoV) emerged as a global health concern in 2012 when the first human case was documented in Saudi Arabia. Then listed as one of the WHO Research and Development Blueprint priority pathogens, cases were reported in 27 countries across four continents. Imported cases into non-endemic countries such as France, Great Britain, the United States, and South Korea had caused secondary cases, thus highlighting the spread of MERS-CoV far beyond the countries where index cases originated. Reports in animals showed that viral circulation was far more widespread than suggested by human cases alone. In this project, we aim to analyse the spread of MERS-CoV and the factors affecting it's intensity.
Project Motivation
With the recent emergence of Covid virus, containing the epidemic requires an understanding of how corona virus spreads, and factors impacting the intensity of cases within and across regions. This project aims at delivering an R shiny app that first provides a basic understanding of the nature of the virus, e.g. the types of pathogens identified in MERS, the kinds of organisms which are susceptible to MERS contraction, and time series analysis to visualize the evolution of MERS outbreak across a 6-years time period (2012-2018). The detailed description of these variables are shown in the Section:Data Description. Geospatio-temporal analysis will be performed to identify the intensity of outbreak in different regions across time. Finally, we will further deep-dive into how certain factors intensifies the spread of the disease using spatial-join analysis.
Proposed Analytical Methods & Visualisation
1. Exploratory Data Analysis
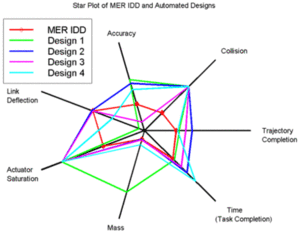
Radar Chart : A radar chart will be used to do multi-variate analysis, for instance, to show the different event types of the armed conflict over different countries in South Asia.
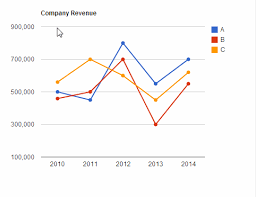
Line Chart : A line chart will be used to visualize the total number of incidents and the number of fatalities in those incidents over different periods of time.
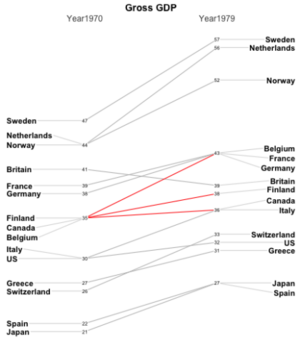
Slope Chart : Compares the ranking of countries over time and intensity of armed conflicts in South Asia over time to get a glimpse of the time series data.
2. Spatio-Temporal Analysis
Spatial Temporal is used to analyse the data across both space and time at the same time. The intent of this analysis is to describe the armed conflicts at a certain location and time. With the help of interactivity in the visualization, the user will be provided with the ability to customize the location and time in the spatial temporal analysis.
To establish this analysis, point pattern analysis will be used to study the spatial arrangement of points in a 2 dimensional space. The spatial temporal analysis will be linked to a study region linked to the point pattern analysis.
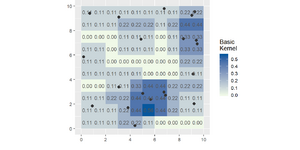
Finally a kernel density plot will be used to highlight the density of the events in the selected filters through a heat-map. The kernel approach computes the localized density of the subsets of the study area.
3. Spatial Join Analysis Visualisations TBC
Project Timeline
Data Description
ACLED data are derived from a wide range of local, regional and national sources and the information is collected by trained data experts worldwide. An updated overview of ACLED’s current coverage is available on the ACLED website. ACLED data are available to the public and are released in real-time. Data can be downloaded through the data export tool on the ACLED website or can be accessed through the API(a manual is available online). Curated data files– such as regional data files, or aggregate country-year files– can also be accessed online on the ACLED website.
| Data Fields | Description | Example | Datatype |
|---|---|---|---|
| iso | A numeric code for each individual country. | 50 | Numeric |
| event_id_cnty | An individual identifier by number and country acronym(updated annually). | BGD17280 | Text |
| event_id_no_cnty | An individual numeric identifier(updated annually). | 17280 | Numeric |
| event_date | The day, month and year on which an event took place. | 1-FEB-20 | Date |
| lat | This field records the latitude in decimal degrees. | 30.209423 | Numeric |
| long | This field records the longitude in decimal degrees. | 67.018009 | Numeric |
| year | The year in which the event took place. | 2020 | Numeric |
| time_precision | A numeric code indicating the level of certainty of the date coded for the event. | 1 | Numeric |
| event_type | The type of event. | Protests | Categorical |
| country | The country in which the event occurred. | Bangladesh | Categorical |
| sub_event_type | The type of sub_event. | Peaceful protest | Categorical |
| actor1 | The named actor involved in the event. | Protesters (Bangladesh) | Categorical |
| assoc_actor_1 | The named actor associated with or identifying ACTOR1. | JSD: Jatiya Samajtantrik Dal | Categorical |
| inter1 | A numeric code indicating the type of ACTOR1. | 6 | Numeric |
| actor2 | The named actor involved in the event. | Civilians (Pakistan) | Categorical |
| assoc_actor_2 | The named actor associated with or identifying ACTOR2. | BNP: Bangladesh Nationalist Party | Categorical |
| inter2 | A numeric code indicating the type of ACTOR2. | 7 | Numeric |
| interaction | A numeric code indicating the interaction between types of ACTOR1 and ACTOR2. | 67 | Numeric |
| region | The region of the world where the event took place. | Southern Asia | Categorical |
| admin1 | The largest sub-national administrative region in which the event took place. | Barisal | Categorical |
| admin2 | The second-largest sub-national administrative region in which the event took place. | Barisal | Categorical |
| admin3 | The third-largest sub-national administrative region in which the event took place. | Barisal | Categorical |
| location | The location in which the event took place. | Barisal | Categorical |
| geo_precision | A numeric code indicating the level of certainty of the location coded for the event. | 1 | Numeric |
| source | The source of the event report. | Daily Star(Bangladesh). | Categorical |
| source_scale | The scale(local, regional, national, international) of the source. | National | Categorical |
| fatalities | The number of reported fatalities which occurred during the event. | 0 | Numeric |
Software Tools
- RStudio: https://rstudio.com/
Proposed R Packages
| Packages | Purpose |
|---|---|
| plotly() | To help with creating visuals for exploratory analysis |
| ggplot2() | To create elegant data visualizations using grammar of graphics |
| trelliscope() | To create interactive trelliscope displays |
| tidyverse() | To do data manipulation and exploration with dplyr() etc |
| gganimate() | To create plots with animation |
| leaflet() | To create maps within the application |
| spatstat() | To analyse spatial data |
| ads() | To analyse geographical data for spatial point pattern analysis |
| GeoXB() | To create interactive spatial exploratory data analysis |
| Shiny() | To create interactive web application for the final product |
References
1. https://acleddata.com/#/dashboard
2. https://mgimond.github.io/Spatial/point-pattern-analysis.html
3. https://en.wikipedia.org/wiki/Point_pattern_analysis
4. https://www.omnisci.com/technical-glossary/spatial-temporal
Team Members
- Oishee Bhattacharyya
- Jaideep Ballani
- Denise Adele Chua Hui Shan


