From Visual Analytics for Business Intelligence
Jump to navigation
Jump to search
Participant Distribution
| Insights
|
Recommendations
|
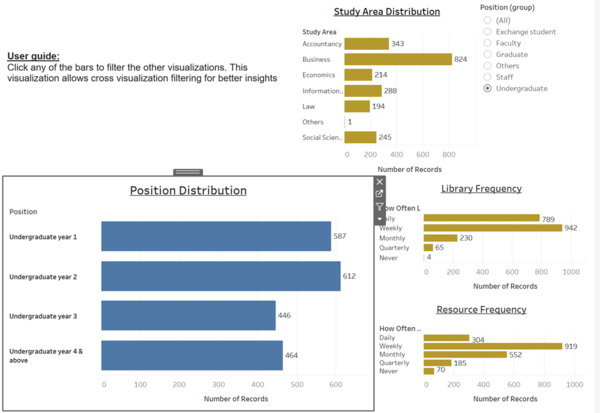
- For undergraduate, most of the participants were from business school, went to the library weekly and used library resources weekly.
- The number of participants for the library survey dwindles as Undergraduate seniority increases. This is probably due to absence from school to fulfill internship and exchange requirements
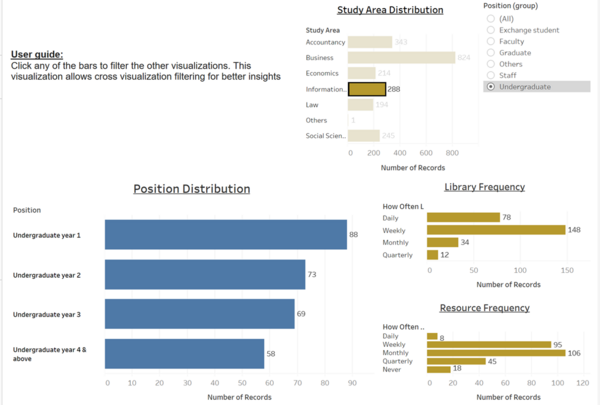
- Having filtered by Information systems students, we can see that the daily visits have dropped in comparison to weekly visits. Also, as undergraduate students progress from year 1-4 their participation in the survey decreases. This could be due the Information Systems students’ dwindling use of library services resulting in them not wanting to participate in the survey.
- However, when we filter by Law school
students, we see that daily visits are dominant. Participation in the survey also holds strong over the years.
|
- Library might want to think of ways of engaging Information Systems students. Possibly by having programming related events in the library.
|
Stated Preference vs Revealed Preference
| Insights
|
Recommendations
|
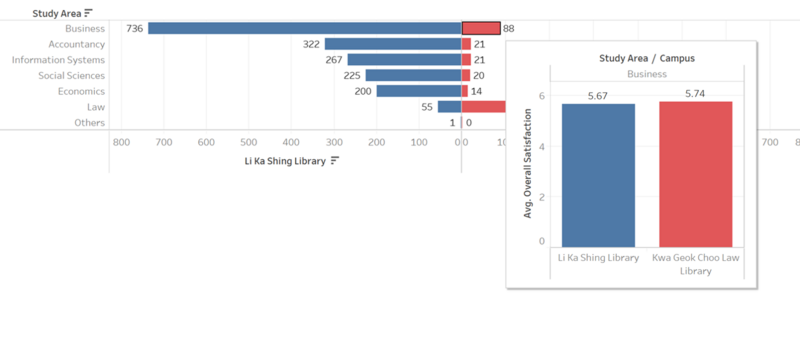
- The Butterfly chart allows us to see the preferences the different faculties have for each library. As can be seen from the chart, with the exception of Law, all faculties had a strong preference for the Li Ka Shing Library. However, when we look at the overall satisfaction of students, business and economics school students rated the KGC library higher but frequented the LKS library more.
- This could be possibly due to the fact that when this survey was conducted in 2018, the Kwa Geok Choo Law Library was a relatively new library and most students would experience resistance to change. Another factor would be distancing. The KGC Law Library is relatively far from the rest of the faculties.
In 2018, there was lack of a sheltered walkway to the law school and also a lack of food options, both problems have since been addressed.
- Another reason could be naming of the library. The inclusion of the word “Law” in the Library name might create an impression of exclusiveness.
|
- Most of the problems have been addressed since 2018, however, there is still room for improvement in the F&B region.
- Possibly remove the word “Law” from the library name.
|
Performance vs Importance
| Insights
|
Recommendations
|
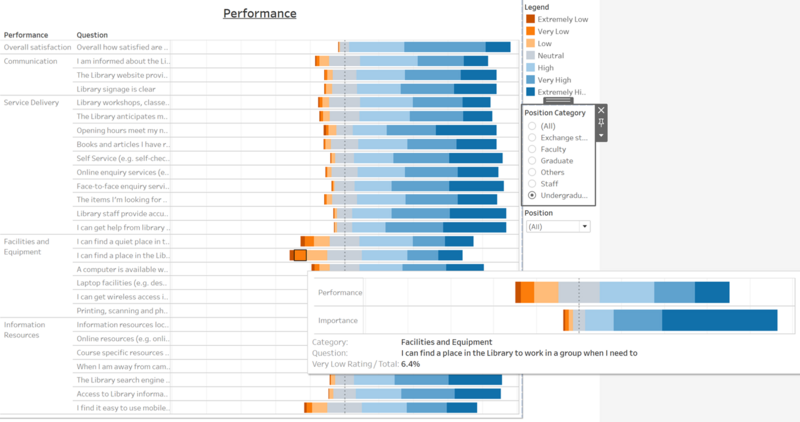
- The likert scale for performance shows the performance of the library services. I have placed the participants overall satisfaction as a benchmark for the metrics. The library should focus efforts on solving problems with low performance yet high importance.
- It is interesting to note that overall satisfaction and did not look consequent of the satisfaction from the metrics. This could mean that there are other variables or metrics not included in the survey which contributed to the participant’s satisfaction.
- The 3 metrics that did the poorest for performance were for the questions “I can find a place in the Library to work in a group when I need to”,"I can find a quiet place to study in the library if I need to" and "I find it easy to use mobile devices (e.g. tablets and phones) to access online resources" Participants have voted these metrics in high importance but are met with low performance.
- Another metric that did poorly for performance was the metric on “A computer is available when I need one. However, this metric was rated as low importance. Comparing performance with importance, this metric did relatively well. It is good that the library does not waste its resources on metrics that the users do not find important.
|
- Create more cow-orking spaces in the library for students to do group activities.
- Enforce the keeping of silence in the library.
- Improve user interface for online resources for mobile devices.
- Find out what other metrics that could possibly contribute to overall satisfaction to include in the survey.
|
Referral
| Insights
|
Recommendations
|
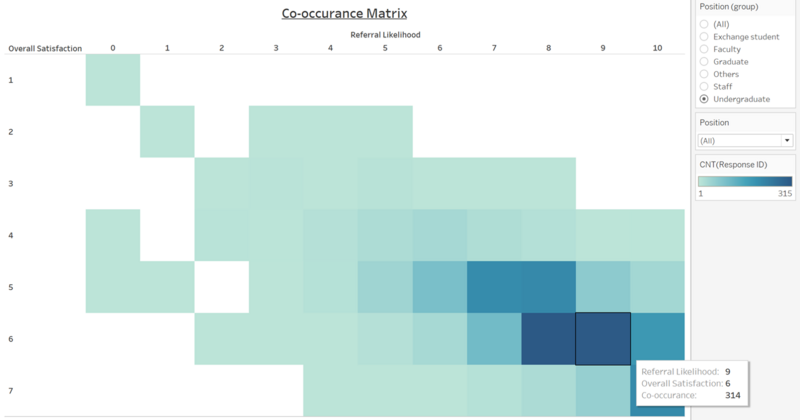
- It can be seen from the co-occurrence matrix that likelihood of referral has a correlation with overall satisfaction. Majority of the participants had a score of 6 for satisfaction and rated the likelihood of referral as 8 or 9. This who had an overall satisfaction of 7 were most likely to vote a 10 for likelihood to refer a friend.
|
Library might want to introduce referral programs where the referral can gain reward for referring a friend. This could both introduce new visitors to the library and increase the satisfaction of the existing library goers.
|


