IS428 AY2019-20T2 YIP JIAN MING
Participant Distribution
Insights
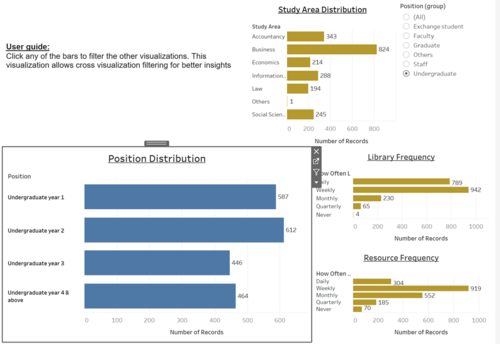
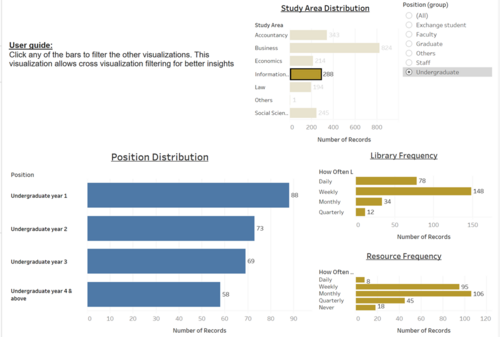
For undergraduate, most of the participants were from business school, went to the library weekly and used library resources weekly. Having filtered by Information systems students, we can see that the daily visits have dropped in comparison to weekly visits. Also, as undergraduate students progress from year 1-4 their participation in the survey decreases. This could be due the Information Systems students’ dwindling use of library services resulting in them not wanting to participate in the survey.
However, when we filter by Law school students, we see that daily visits are dominant. Participation in the survey also holds strong over the years.
Recommendations
Library might want to think of ways of engaging Information Systems students. Possibly by having programming related events in the library.
Stated Preference vs Revealed Preference
Insights
For undergraduate, most of the participants were from business school, went to the library weekly and used library resources weekly. Having filtered by Information systems students, we can see that the daily visits have dropped in comparison to weekly visits. Also, as undergraduate students progress from year 1-4 their participation in the survey decreases. This could be due the Information Systems students’ dwindling use of library services resulting in them not wanting to participate in the survey.
However, when we filter by Law school students, we see that daily visits are dominant. Participation in the survey also holds strong over the years.
Recommendations
Library might want to think of ways of engaging Information Systems students. Possibly by having programming related events in the library.


