Difference between revisions of "IS428 AY2019-20T2 YIP JIAN MING"
Jmyip.2016 (talk | contribs) (Created page with " <!--Header--> {|style="background-color:#0B2161; color:#343436; padding: 10 0 10 0;" width="100%" cellspacing="0" cellpadding="0" valign="top" border="0" | | style="padding...") |
Jmyip.2016 (talk | contribs) |
||
| Line 29: | Line 29: | ||
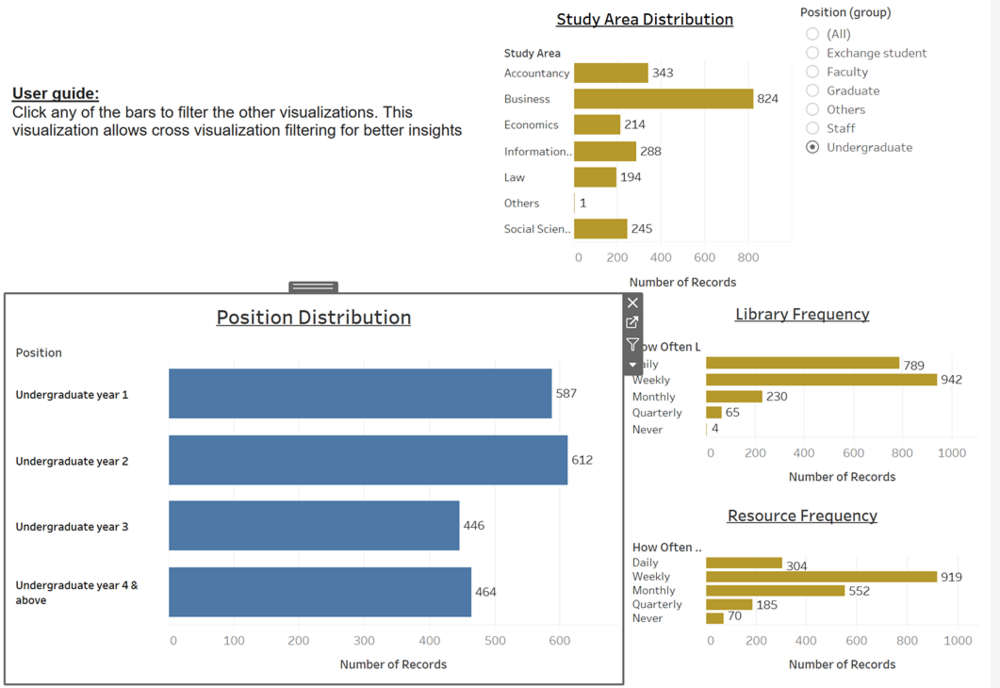
While observing the frequency chart, the general visitations to campus is almost daily with a portion of the respondents only visiting campus weekly visits. Library visits on the other hand have almost equal visitations frequencies between daily and weekly. Higher frequency of accessing library resources range from weekly to monthly visits. | While observing the frequency chart, the general visitations to campus is almost daily with a portion of the respondents only visiting campus weekly visits. Library visits on the other hand have almost equal visitations frequencies between daily and weekly. Higher frequency of accessing library resources range from weekly to monthly visits. | ||
| − | |||
| − | |||
| − | |||
Revision as of 15:51, 15 March 2020
Participant Distribution
Insights
Recommendations
Following the assignment requirements, I will only be focusing on the main 4 groups of respondents, hence, descriptions and insights will only focus on Undergraduates, Postgraduates, Faculty and Staff, excluding the "Other" category. Looking at the various library visits is it observed that there was a vast difference in the ratio of visits between KGC and LKS libraries. Each of the respondent groups seem to prefer visiting the LKS library to KGC library by at least 75% more.
While observing the frequency chart, the general visitations to campus is almost daily with a portion of the respondents only visiting campus weekly visits. Library visits on the other hand have almost equal visitations frequencies between daily and weekly. Higher frequency of accessing library resources range from weekly to monthly visits.
