Difference between revisions of "IS428 AY2019-20T2 YIP JIAN MING"
Jump to navigation
Jump to search
Jmyip.2016 (talk | contribs) |
Jmyip.2016 (talk | contribs) |
||
| Line 81: | Line 81: | ||
|- | |- | ||
| | | | ||
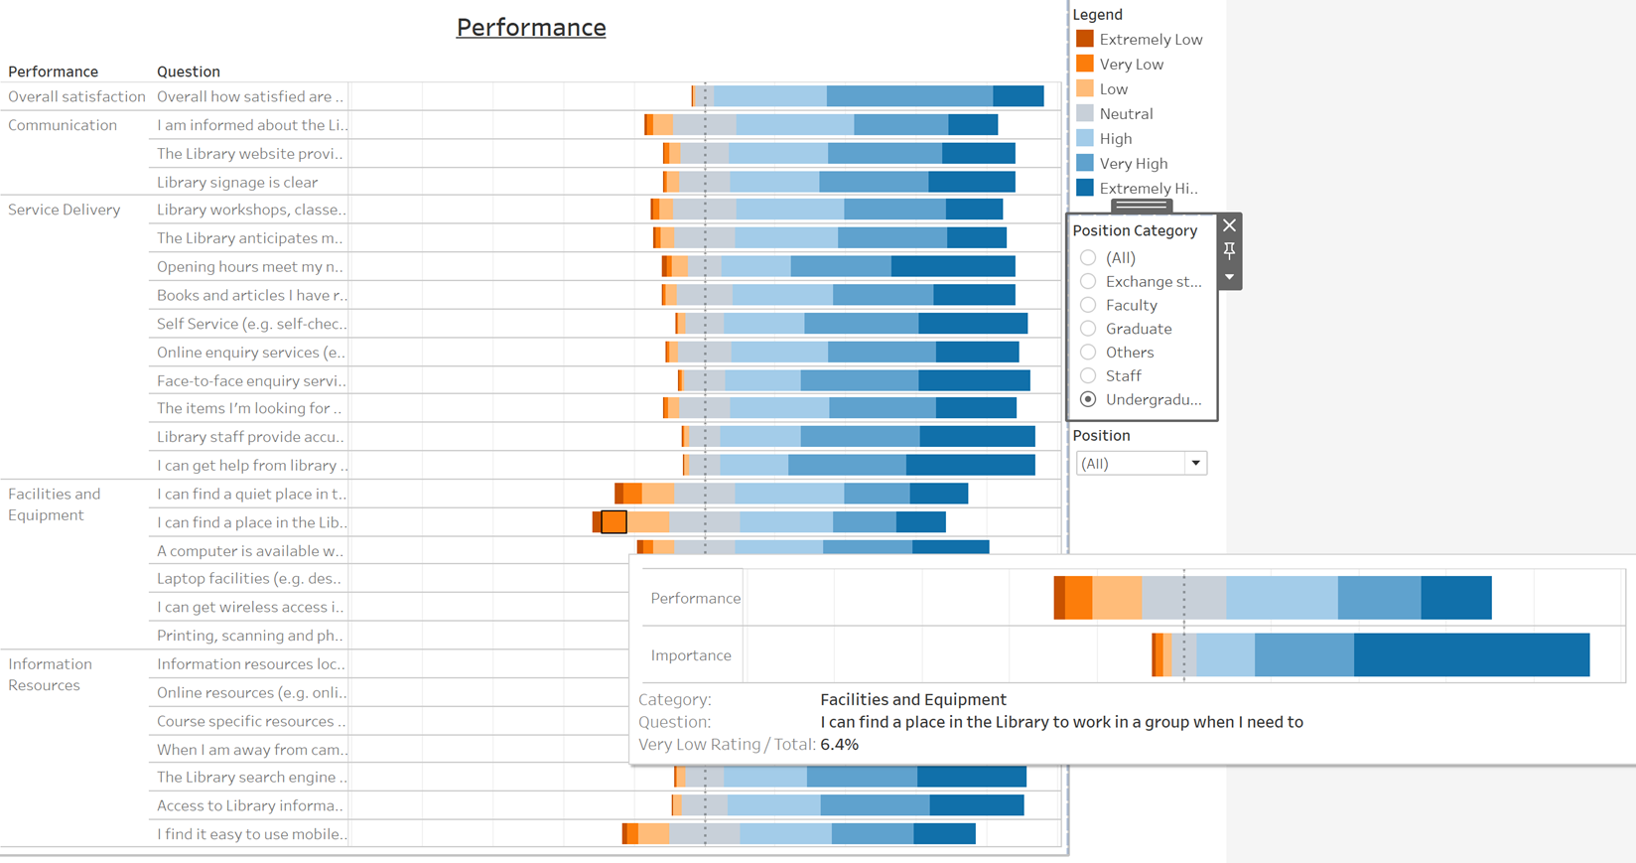
| − | *The | + | *The likert scale for performance shows the performance of the library services. I have placed the participants overall satisfaction as a benchmark for the metrics. The library should focus efforts on solving problems with low performance yet high importance. |
| − | + | ||
| − | + | *It is interesting to note that overall satisfaction and did not look consequent of the satisfaction from the metrics. This could mean that there are other variables or metrics not included in the survey which contributed to the participant’s satisfaction. | |
| − | *Another | + | |
| + | *The 3 metrics that did the poorest for performance were for the questions “I can find a place in the Library to work in a group when I need to”,"I can find a quiet place to study in the library if I need to" and "I find it easy to use mobile devices (e.g. tablets and phones) to access online resources" Participants have voted these metrics in high importance but are met with low performance. | ||
| + | |||
| + | *Another metric that did poorly for performance was the metric on “A computer is available when I need one. However, this metric was rated as low importance. Comparing performance with importance, this metric did relatively well. It is good that the library does not waste its resources on metrics that the users do not find important. | ||
| + | |||
|| | || | ||
| − | * | + | *Create more coworking spaces in the library for students to do group activities. |
| − | * | + | *Enforce the keeping of silence in the library. |
| + | *Improve user interface for online resources for mobile devices. | ||
| + | *Find out what other metrics that could possibly contribute to overall satisfaction to include in the survey. | ||
| + | |||
|- | |- | ||
|} | |} | ||
</center> | </center> | ||
</br> | </br> | ||
Revision as of 16:55, 15 March 2020
Participant Distribution
| Insights | Recommendations |
|---|---|
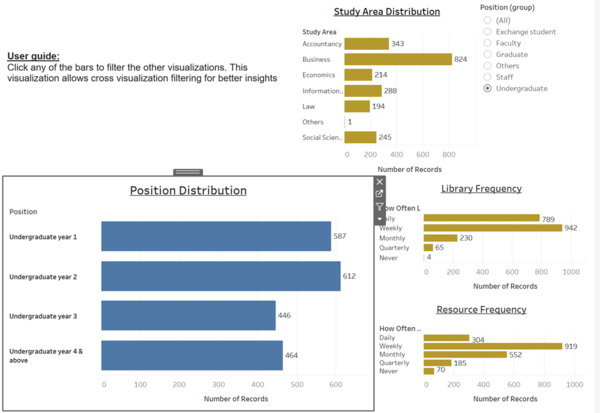
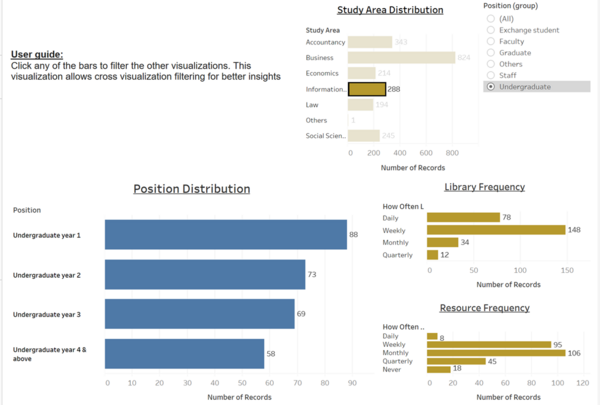
students, we see that daily visits are dominant. Participation in the survey also holds strong over the years. |
|
Stated Preference vs Revealed Preference
| Insights | Recommendations |
|---|---|
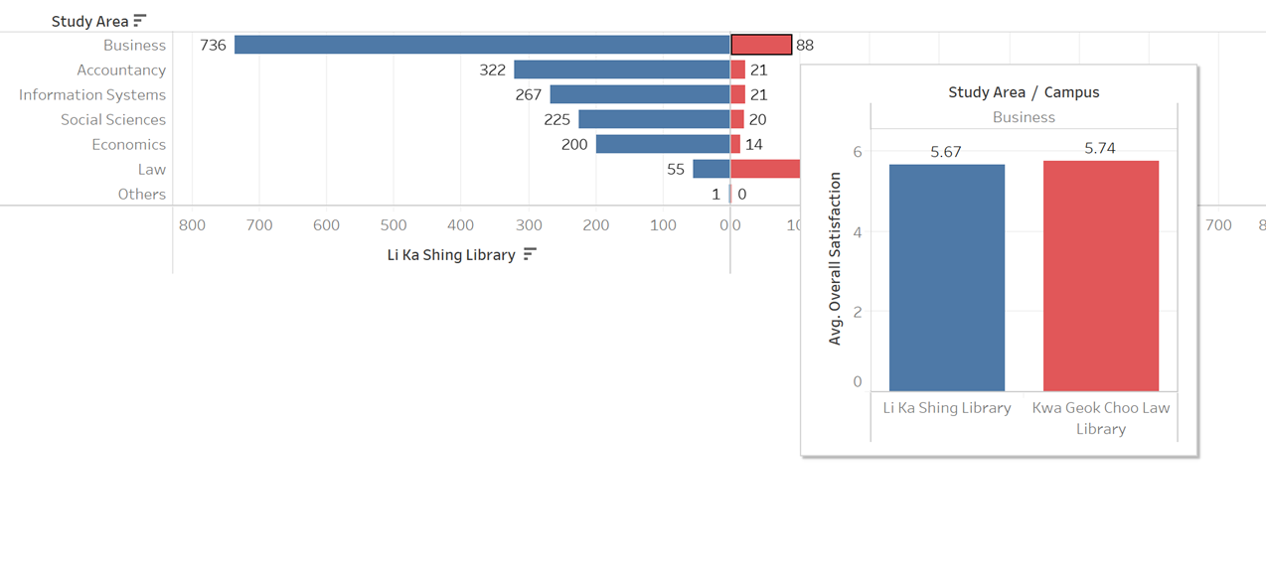
In 2018, there was lack of a sheltered walkway to the law school and also a lack of food options, both problems have since been addressed.
|
|
Performance vs Importance
| Insights | Recommendations |
|---|---|
|
|


