Difference between revisions of "Faculty"
| Line 70: | Line 70: | ||
| style="background:none;" width="1%" | | | style="background:none;" width="1%" | | ||
| − | | style="padding:0.2em; font-size:100%; background-color:#343436;border-bottom:5px solid | + | | style="padding:0.2em; font-size:100%; background-color:#343436;border-bottom:5px solid #CC9900; text-align:center; color:#F5F5F5" width="10%" | |
[[Faculty|<font color="#CC9900" size=4 face="Agency FB">Faculty</font>]] | [[Faculty|<font color="#CC9900" size=4 face="Agency FB">Faculty</font>]] | ||
|} | |} | ||
Revision as of 18:07, 12 March 2020
Overview
Every two years, SMU Libraries conduct a comprehensive survey in which faculty, students and staff have the opportunity to rate various aspects of SMU library's services. The survey provides SMU libraries with input to help enhance existing services and to anticipate emerging needs of SMU faculty, students and staff. The latest survey is currently on going and will be ended by 17th February 2020.
The past reports are mainly made-up of pages of tables, which are very difficult to comprehend. In view of this, your task is to apply appropriate data visualisation to transform these tables into visual representation that allow SMU libraries to gain useful insights.
Data Cleaning & Preparation
About
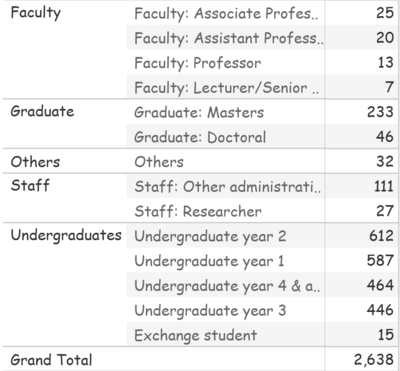
An overview of the library 2018 survey results found that there are 2638 respondents in total that responded to various parts of the 83 survey questions with respect to the performance and importance level of the library and other general questions to understand the patron's sentiments of the SMU Library. Here is the breakdown of the users that frequent the SMU library
As seen from figure 1, predominantly, most of the survey respondents comes from undergraduates with some from other areas such as graduates, faculty, staff and others. In order to gain more insights from the survey results, we will first do some pre-processing and cleaning of the data.
Cleaning
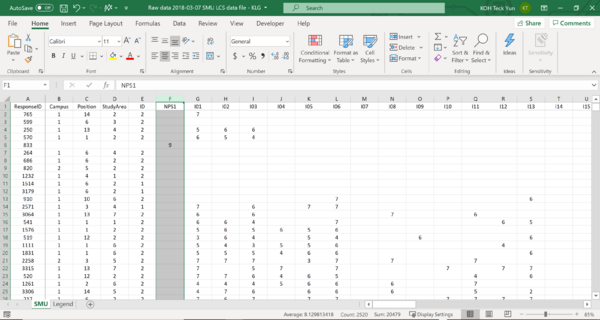
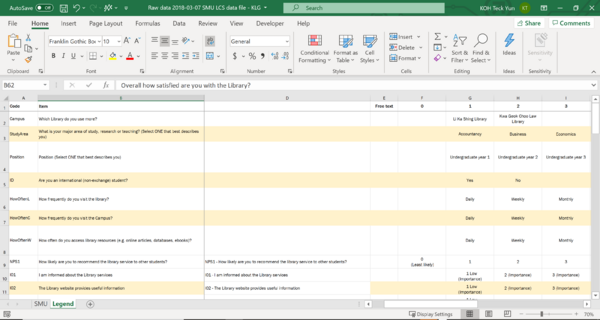
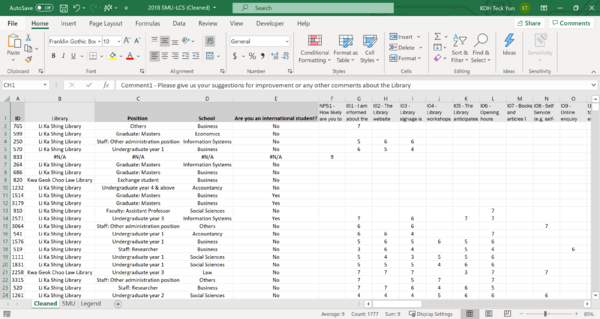
| Step | Screen shot | Explanation |
|---|---|---|
|
|
| |
|
|
| |
|
|
Findings
- Insert Text Here
Revealed Insights
- Insert Text Here
Report
- Insert Text Here


