IS428 AY2019-20T2 Assign KOH TECK YUN
Overview
Every two years, SMU Libraries conduct a comprehensive survey in which faculty, students and staff have the opportunity to rate various aspects of SMU library's services. The survey provides SMU libraries with input to help enhance existing services and to anticipate emerging needs of SMU faculty, students and staff. The latest survey is currently on going and will be ended by 17th February 2020.
The report provided in the 2018 survey covered specific aspects of every school. These aspects of the report has been recreated and concise into the following visualisations on Tableau Public -Tableau Public
These covers four area groups of respondents which feedback accordingly to two major areas which are performance and importance.
Data Cleaning & Preparation
About
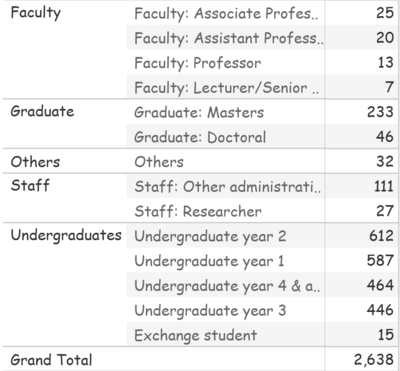
An overview of the library 2018 survey results found that there are 2638 respondents in total that responded to various parts of the 83 survey questions with respect to the performance and importance level of the library and other general questions to understand the patron's sentiments of the SMU Library. Here is the breakdown of the users that frequent the SMU library
As seen from figure 1, predominantly, most of the survey respondents comes from undergraduates with some from other areas such as graduates, faculty, staff and others. In order to gain more insights from the survey results, we will first do some pre-processing and cleaning of the data.
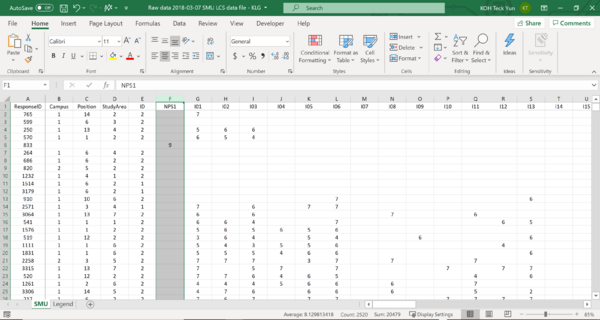
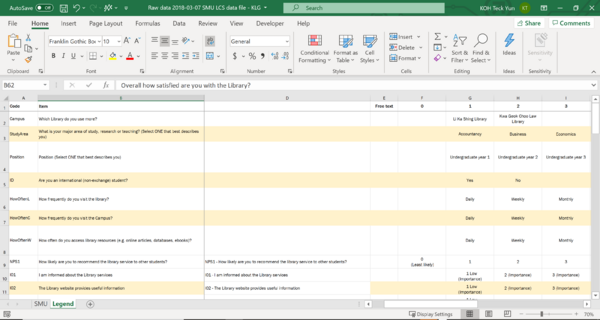
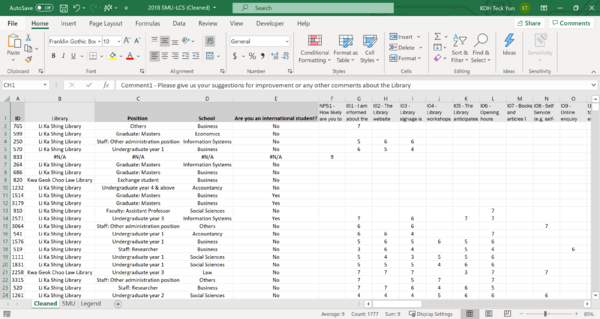
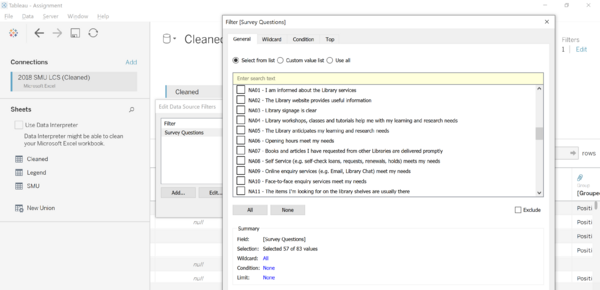
Cleaning
| Step | Screen shot | Explanation |
|---|---|---|
|
|
| |
|
|
| |
|
Preparation of Dashboard
- As taught in class, I will be using predominantly likert scale to represent the data set with a few other visualisations to highlight various areas of the report. The following six fields will be utilised in the preparation of the visualisation
1. Count Negative
[IF [Ratings] < 5 then 1
ELSEIF [Ratings] = 5 then 0.5
ELSE 0
END]
2. Gantt Percent
[PREVIOUS_VALUE(Overall Gantt Start]) + ZN(LOOKUP(Overall Percentage],-1))]
3. Gantt Start
[-Overall Total Count Negative] / Overall Total Count]]
4. Percentage
[SUM([Number of Records])/Overall Total Count]]
5. Total Count
[TOTAL(SUM([Number of Records]))]
6. Total Count Negative
[TOTAL(SUM(Overall Count Negative]))]
Findings
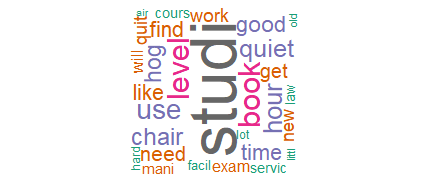
Here are some of the common comments that appear from the respondents that gave feedback with respect to the library. The words that appear consistently are study, level, book, good, quiet and many more. The key terms here are the few of the many key functions of SMU library which are book borrowing and lending.
Using various visualisation techniques, there were numerous unique findings found throughout the survey under each group of respondents, namely
- Undergraduates
- Graduates
- Faculty
- Staff
- Others
Where we will be focusing on the first four groups.
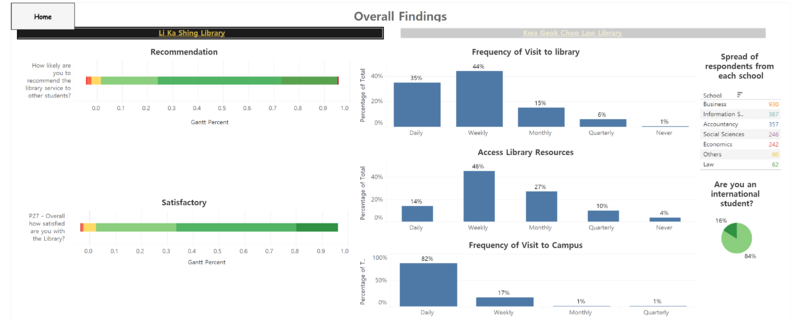
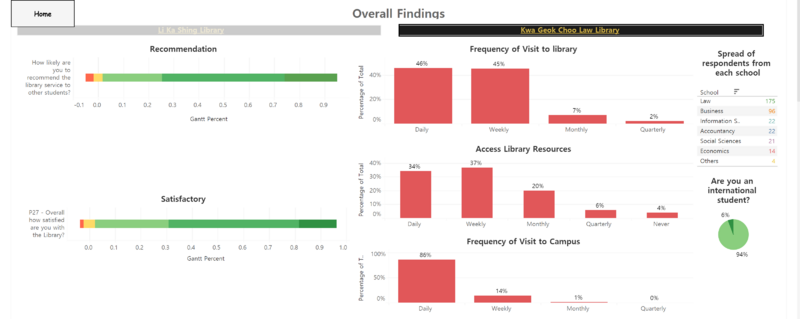
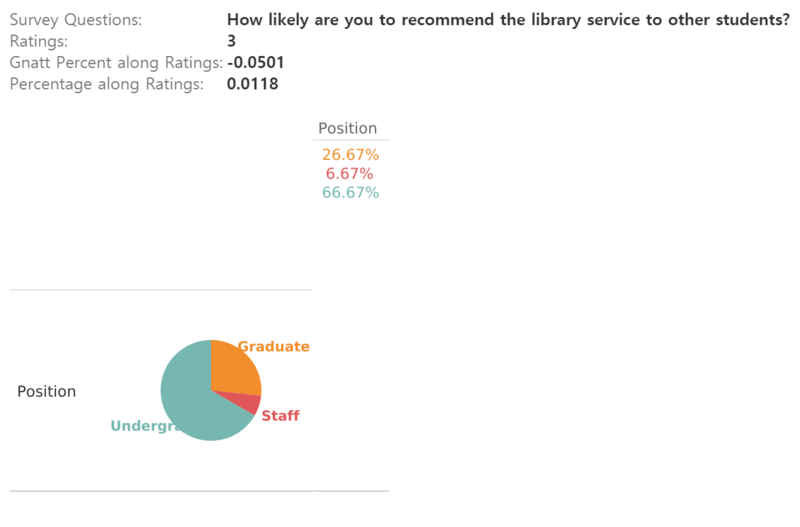
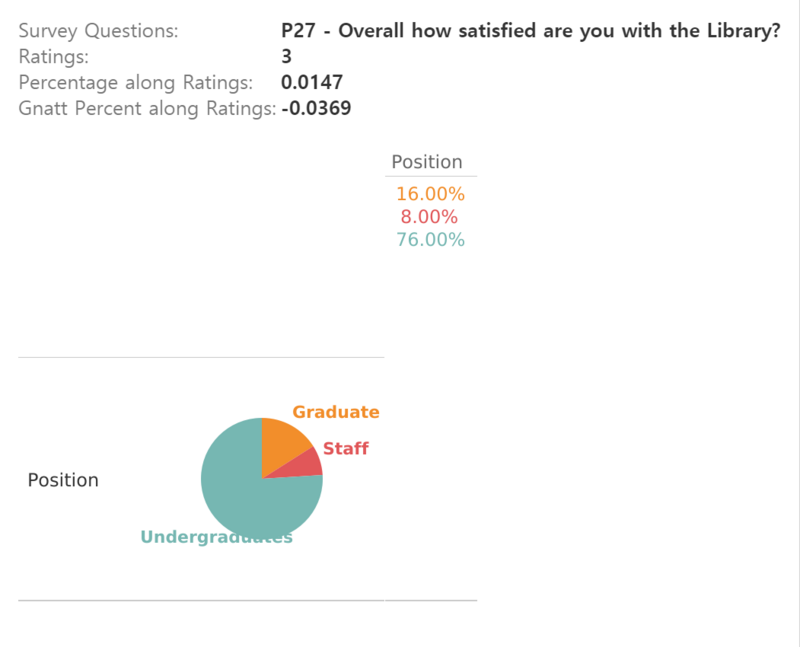
- From the given pictures above, we notice that the Respondents are more than likely to recommend either library to other people with the majority of them giving a positive review of the library of 7 and above.
- When we look at the frequency from image 1, we notice that most respondents visit the campus daily yet the daily visit and accessing the library resource are of low percentage.
- Interestingly, there were staff and faculty members giving a rating of 3 from image 3 and 4.
Revealed Insights
After looking at the four groups of respondents, namely
- Undergraduates
- Graduates
- Staff
- Faculty
| LKS | KGC |
|---|---|
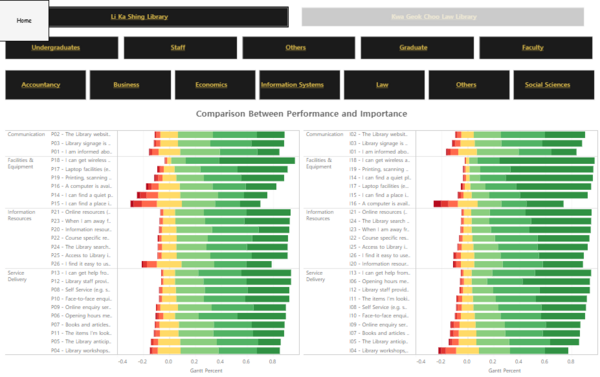
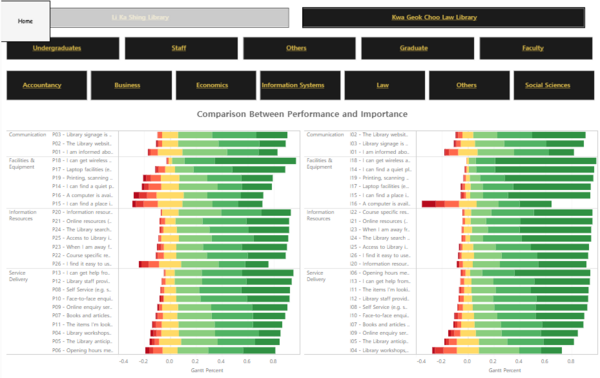
We see a similar pattern of poorly performing areas and some areas which are performing up to what the respondents have expected of either libraries. However, the two areas that performed poorly as commonly seen throughout the survey are Information resources and Facilities & Equipment. To concise the insights gathered from the four areas, the following highlights the good and bad performing areas of both libraries.
Positive Insights
- The opening hours of both libraries generally satisfy the need of most respondents, as seen by the 24 hours services provided by the libraries and both library generally are prompt in its opening.
- The internet access wifi spot as highlighted by most groups are generally satisfied and performing well.
- The website services usually provide ample information on the type of services that they are providing on the site.
- Generally, the laptop [Power sources|Tables] are well-provided in either library, although KGC have several number of people highlighting that there is still a lack of such services.
- Accessibility of online resources are easy to most groups of respondents.
- The library anticipates well the needs of most group of respondents by providing them with the necessary materials that they need.
- Services provided in general by the library are of satisfactory to good level for most group of respondents.
- Printing and scanning are generally positive feedback by most of the group of respondents
Negative Insights
- Generally, the poorly performing areas are that either libraries do not provide ample quiet places to users to use.
- The amount of meeting rooms provided are also not adequate to meet the demands of the users of either libraries.
- A computer is not as available in either libraries for the users to use.
- Library workshops are generally ineffective and not as useful to undergraduates as opposed to other group of respondents.
- Library signage generally clearer at LKS.
