Difference between revisions of "IS428 AY2019-20T2 Assign KOH TECK YUN"
| Line 42: | Line 42: | ||
| <center>3 | | <center>3 | ||
| | | | ||
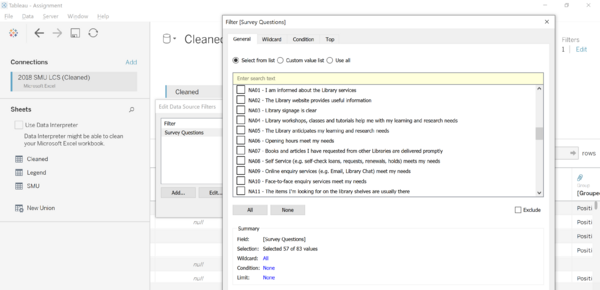
| − | + | [[File:Tableau Filter.png|600px|frameless|center]] | |
| | | | ||
*After further inspection of the survey questions, there is 26 survey questions that are irrelevant towards the insights that will be generated later on. The survey questions that fall under the ID code 'NA' to filtered and removed under the 'Datasource' tab. | *After further inspection of the survey questions, there is 26 survey questions that are irrelevant towards the insights that will be generated later on. The survey questions that fall under the ID code 'NA' to filtered and removed under the 'Datasource' tab. | ||
Revision as of 17:19, 15 March 2020
Overview
Every two years, SMU Libraries conduct a comprehensive survey in which faculty, students and staff have the opportunity to rate various aspects of SMU library's services. The survey provides SMU libraries with input to help enhance existing services and to anticipate emerging needs of SMU faculty, students and staff. The latest survey is currently on going and will be ended by 17th February 2020.
The past reports are mainly made-up of pages of tables, which are very difficult to comprehend. In view of this, your task is to apply appropriate data visualisation to transform these tables into visual representation that allow SMU libraries to gain useful insights.
Data Cleaning & Preparation
About
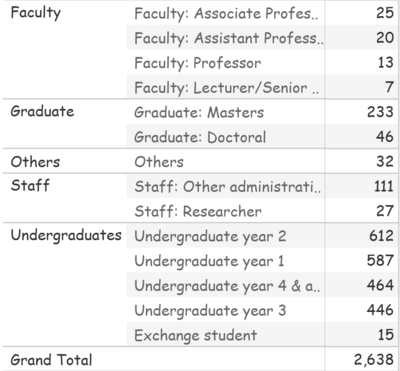
An overview of the library 2018 survey results found that there are 2638 respondents in total that responded to various parts of the 83 survey questions with respect to the performance and importance level of the library and other general questions to understand the patron's sentiments of the SMU Library. Here is the breakdown of the users that frequent the SMU library
As seen from figure 1, predominantly, most of the survey respondents comes from undergraduates with some from other areas such as graduates, faculty, staff and others. In order to gain more insights from the survey results, we will first do some pre-processing and cleaning of the data.
Cleaning
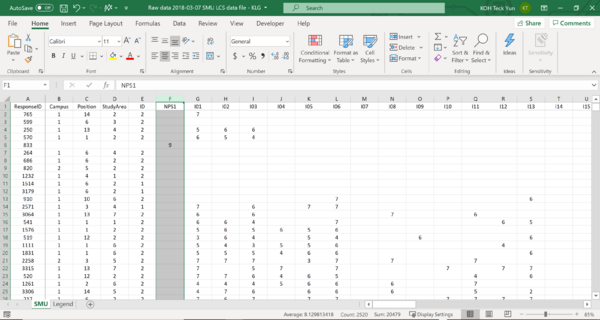
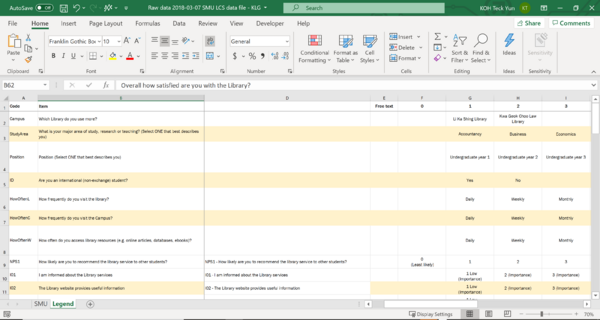
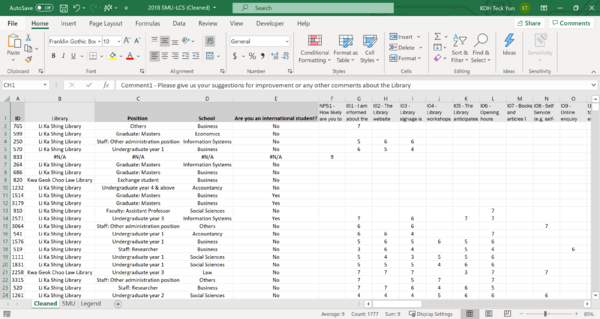
| Step | Screen shot | Explanation |
|---|---|---|
|
|
| |
|
|
| |
|
Findings
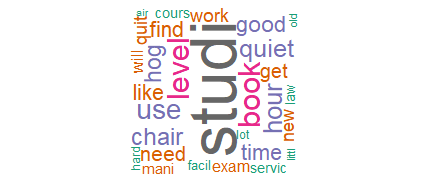
Here are some of the common comments that appear from the respondents that gave feedback with respect to the library. The words that appear consistently are study, level, book, good, quiet and many more. The key terms here are the few of the many key functions of SMU library which are book borrowing and lending.
Using various visualisation techniques, there were numerous unique findings found throughout the survey under each group of respondents, namely
- Undergraduates
- Graduates
- Faculty
- Staff
- Others
Where we will be focusing on the first four groups.
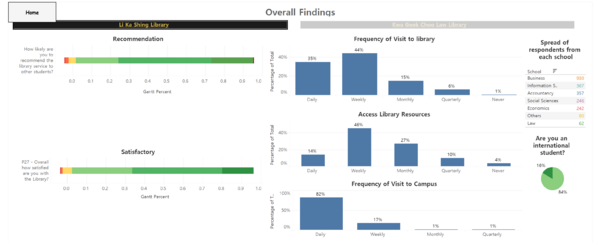
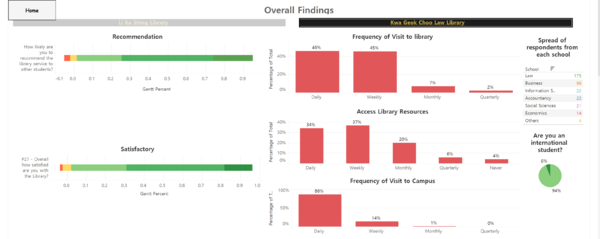
- From the given pictures above, we notice that the Respondents are more than likely to recommend either library to other people with the majority of them giving a positive review of the library of 7 and above.
- When we look at the frequency from image 1, we notice that most respondents visit the campus daily yet the daily visit and accessing the library resource are of low percentage.
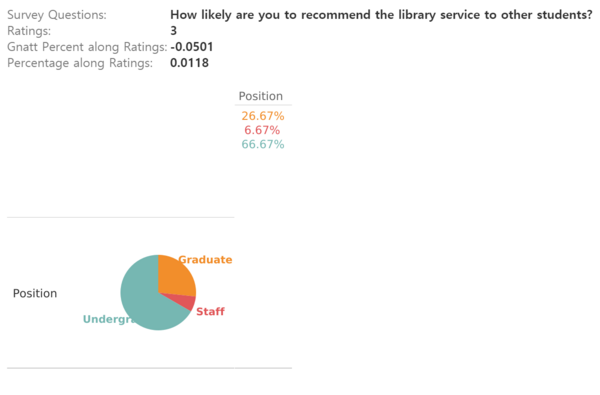
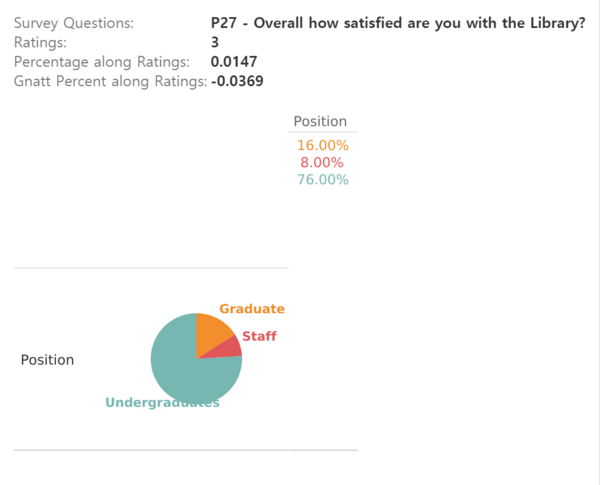
- Interestingly, there were staff and faculty members giving a rating of 3 from image 3 and 4.
Others shared certain key view points below:
Revealed Insights
- Insert Text Here
Report
- Insert Text Here
