Difference between revisions of "IS428 AY2019-20T2 Assign TANNY LAI"
| Line 54: | Line 54: | ||
'''Solution:''' In order to solve the issue of too many columns for the same data attribute I put the dataset with the codes into TableauPrep and pivot it three times. Firstly, I pivot the HowOften attribute. Continuously, I pivot Importance and Performance together and lastly, I pivot NA. Finally, I output it in a TDE file format. | '''Solution:''' In order to solve the issue of too many columns for the same data attribute I put the dataset with the codes into TableauPrep and pivot it three times. Firstly, I pivot the HowOften attribute. Continuously, I pivot Importance and Performance together and lastly, I pivot NA. Finally, I output it in a TDE file format. | ||
| − | 2. Despite preparing the data by using pivot, the data was still not ready for analysis as they were in code format which was hard for a user who is not familiar to understand. | + | 2. Despite preparing the data by using pivot, the data was still not ready for analysis as they were in code format which was hard for a user who is not familiar to understand. |
| − | [[File:Tableau2.jpg| | + | [[File:Tableau2.jpg|300px|frameless]] [[File:Tableau3.jpg|300px|frameless]] [[File:Tableau4.jpg|300px|frameless]] |
| − | [[File:Tableau5.jpg| | + | [[File:Tableau5.jpg|300px|frameless]] [[File:Tableau6.jpg|300px|frameless]] [[File:Tableau7.jpg|300px|frameless]] |
| − | [[File:Tableau 8.jpg| | + | [[File:Tableau 8.jpg|300px|frameless]] [[File:Tableau 9.jpg|300px|frameless]]<br> |
| − | '''Solution:''' Since the dataset is in code format, to make it easier for the user who will be using the analytic dashboard, I had created calculated fields to help convert the data. I avoided using Alias although it gets the job done faster, the user will have to create their own alias every time they create a new Tableau file and it will be troublesome. By creating a calculated field, the code can be reused and the user will not be required to do alias multiple times. | + | '''Solution:''' Since the dataset is in code format, to make it easier for the user who will be using the analytic dashboard, I had created calculated fields to help convert the data. I avoided using Alias although it gets the job done faster, the user will have to create their own alias every time they create a new Tableau file and it will be troublesome. By creating a calculated field, the code can be reused and the user will not be required to do alias multiple times. Total, for the dataset I had created calculated fields to rename the codes for the attributes: Study Area, Position, HowOften Responses, Yes No(NA) Question Title, Importance and Performance, Importance and Performance Question Categories, Importance and Performance Question Title, Response Label, and YN (NA) Question Categories. |
| + | [[File:Tableau1.jpg|300px|frameless]] | ||
| + | Also, as we're only interested in certain positions that fall in the groups - undergraduate students, postgraduate students, faculty, and staff. I had created a calculated field just for the interested groups. | ||
| + | 3. NPS | ||
| + | |||
| + | 4. Likert Scale for Importance and Performance | ||
| + | |||
| + | 5. Gap | ||
== Dashboard == | == Dashboard == | ||
Revision as of 21:07, 14 March 2020
Contents
Problem & Motivation
Problem
Every two years, SMU Libraries conduct a comprehensive survey in which faculty, students and staff have the opportunity to rate various aspects of SMU library's services. The survey provides SMU libraries with input to help enhance existing services and to anticipate emerging needs of SMU faculty, students and staff. However, the survey results presented by InSync lack of friendly and interactive visualization to aid the library staffs to easily understand the results and derive value-adding insights.
Motivation
In class, we have learned that we should always use a divergent stack bar chart to do analysis on Likert scales and not to find the average of the scale. Upon viewing the survey report done by Insync, I feel inspired to apply the concepts, methods, and techniques I have learned in my Visual Analytics IS428 class. Furthermore, it would be far more interesting and practical to be able to resolve real-world problems using visual analytics skills that I have learned.
The interactive visualization can reveal the level of services provided by SMU libraries as perceived by:
- The undergraduate students,
- The postgraduate students,
- The faculty,
- The staff
Dataset Analysis & Transformation Process
Understanding the dataset Before diving in to do an in-depth analysis and creating charts, it is essential to understand the dataset given and identify the best method for data preparation by understanding the respective format and attributes(columns). The dataset provided in the assignment consists of 2 datasheets:
1. The data in codes and number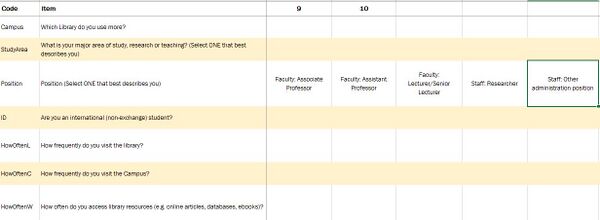
2. The legend to describe the data in layman terms.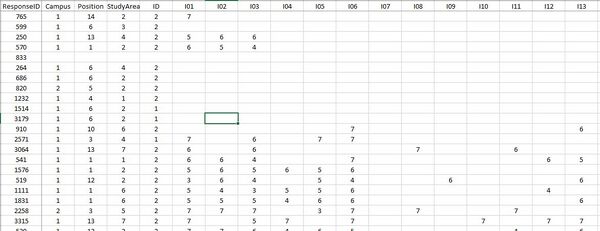
This section will elaborate on the dataset analysis and transformation process for the dataset in order to prepare the data for import and analysis on interactive visualization.
Firstly, I identified that the dataset contains three types of data - demographic, behavioral and feedback/opinions.
Under demographic data types, the dataset has surveyee's data on:
- StudyArea - Major area of study, research or teaching
- Position - Position in SMU (1 column)
- ID - International (non-exchange) student (1 column)
Under behavioral data types, the dataset has surveyee's data on:
- Campus - Library mostly used (1 column)
- HowOften- How frequently do you visit the library/campus/access library resources (3 columns)
Under feedback data types, the dataset has surveyee's data on:
- NPS - How likely surveyee is to recommend the library service to other students (1 column)
- Importance- A list of importance ratings for 26 library services (26 columns)
- Performance- A list of performance ratings for 26 library services (26 columns) and surveyee's satisfaction with the library (1 column)
- Comments - Suggestions for improvement or any other comments about the Library (1 column)
- NA - Are the services applicable to the surveyee? (1 column)
Transformation 1. After understanding the dataset, it is noticeable that the data attributes HowOften, Importance, Performance, and NA needs to be pivot as they have many columns and this would make data analysis for the charts tough at the later steps.

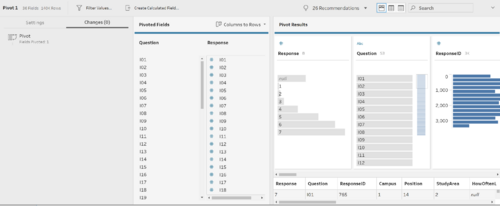 Solution: In order to solve the issue of too many columns for the same data attribute I put the dataset with the codes into TableauPrep and pivot it three times. Firstly, I pivot the HowOften attribute. Continuously, I pivot Importance and Performance together and lastly, I pivot NA. Finally, I output it in a TDE file format.
2. Despite preparing the data by using pivot, the data was still not ready for analysis as they were in code format which was hard for a user who is not familiar to understand.
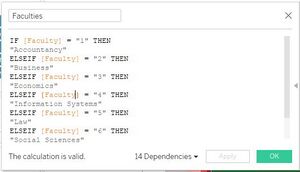
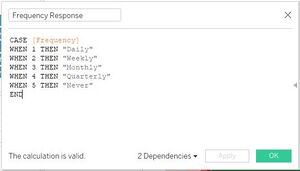
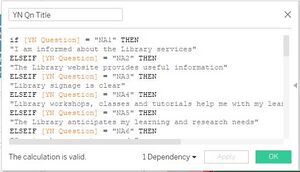
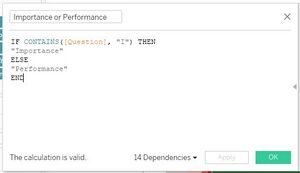
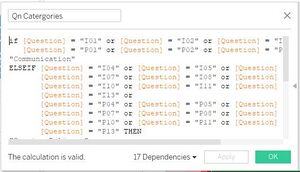
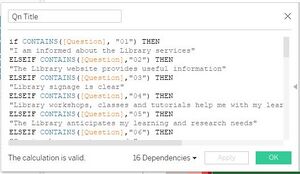
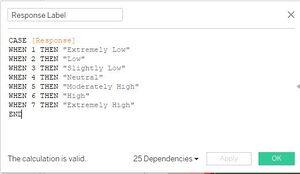
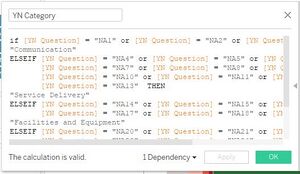
Solution: Since the dataset is in code format, to make it easier for the user who will be using the analytic dashboard, I had created calculated fields to help convert the data. I avoided using Alias although it gets the job done faster, the user will have to create their own alias every time they create a new Tableau file and it will be troublesome. By creating a calculated field, the code can be reused and the user will not be required to do alias multiple times. Total, for the dataset I had created calculated fields to rename the codes for the attributes: Study Area, Position, HowOften Responses, Yes No(NA) Question Title, Importance and Performance, Importance and Performance Question Categories, Importance and Performance Question Title, Response Label, and YN (NA) Question Categories.
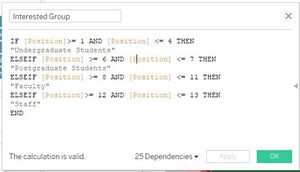 Also, as we're only interested in certain positions that fall in the groups - undergraduate students, postgraduate students, faculty, and staff. I had created a calculated field just for the interested groups.
3. NPS
4. Likert Scale for Importance and Performance
5. Gap