IS428 AY2019-20T2 Assign SIM HUEI MIN AARON
Contents
Problem and Motivation
Every two years, SMU Libraries conduct a comprehensive survey in which faculty, students and staff have the opportunity to rate various aspects of SMU library's services. The survey provides SMU libraries with input to help enhance existing services and to anticipate emerging needs of SMU faculty, students and staff.
Objectives
The 2018 Survey Results past reports are mainly made-up of pages of tables, which are very difficult to comprehend. In view of this, there is a need to apply appropriate data visualisation to transform these tables into visual representation that allow SMU libraries to gain useful insights.
The insights revealed in the Insights and Recommendations tab will cover the following areas of interest:
- Undergraduate Students
- Postgraduate Students
- Faculty
- Staff
Data Cleaning
Renaming of Column Variables
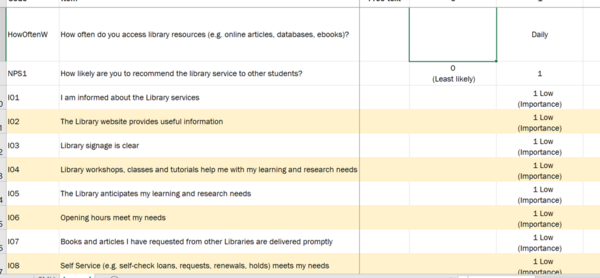
To make the dataset more easier to work with and easier to comprehend, I have to rename the columns that corresponds to their equal value in the legend.
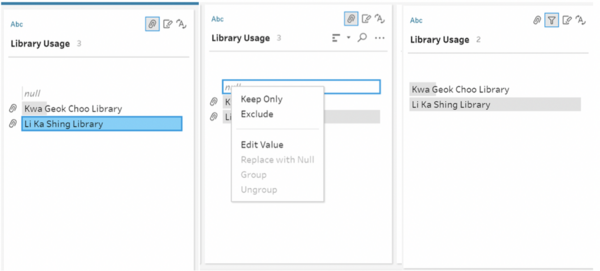
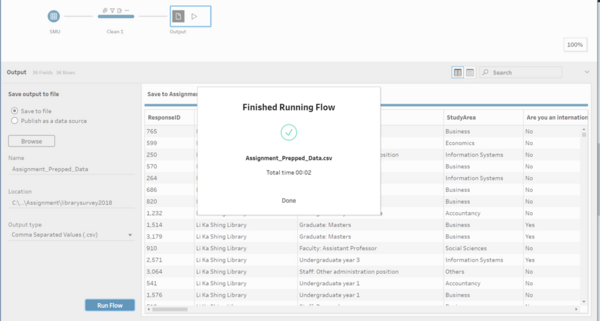
Furthermore, I have changed the data type from numeric to string to input text as data. It can be seen that there are null values in the data set hence we have to remove the null value using Tableau Prep Builder。
Groupings of Respondent Types
Furthermore, since our insights and recommendations will be focused on 4 groups only, we will created groups to combine type of survey respondents.
Undergraduate students will consist of the following respondent type:
- Undergraduate year 1
- Undergraduate year 2
- Undergraduate year 3
- Undergraduate year 4 & above
- Exchange student
Postgraduate students will consist of the following respondent type:
- Graduate: Masters
- Graduate: Doctoral
Faculty will consist of the following respondent type:
- Faculty: Professor
- Faculty: Associate Professor
- Faculty: Assistant Professor
- Faculty: Lecturer/Senior Lecturer
Staff will consist of the following respondent type:
- Staff: Researcher
- Staff: Other administration position
- Others
Home Dashboard
The following shows the home dashboard:
The interactive visualization can be accessed here: https://public.tableau.com/profile/aaron.sim4178#!/vizhome/Assignment_working/Dashboard2
Survey Results Analysis – Diverging Bar Chart
Undergraduate Students
Based on the dashboard we can find a few things that are interesting.
| S/N | Insight | Recommendations |
|---|---|---|
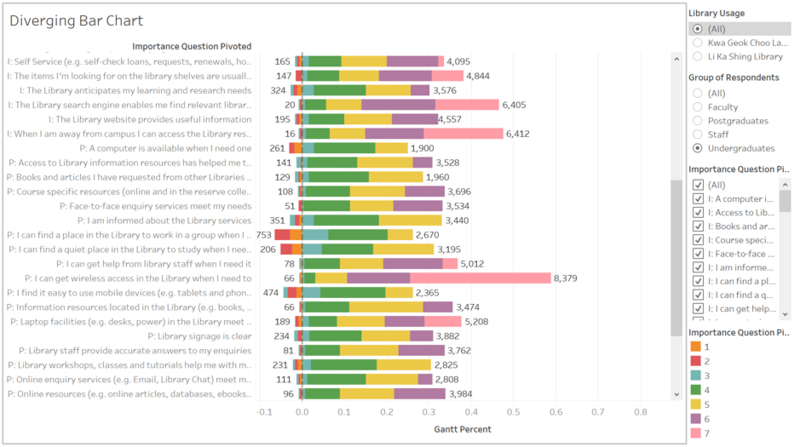
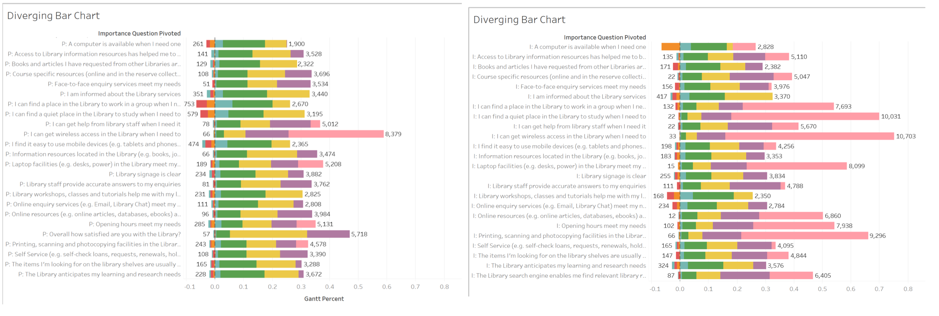
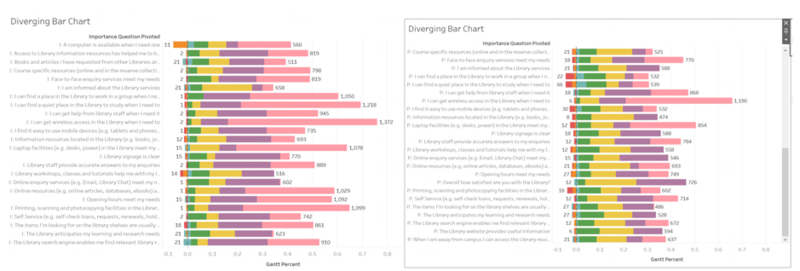
| By placing both the performance evaluation and importance evaluation by Undergraduates side by side, we are able to clearly see that the SMU libraries are not performing up to their expected standards. As can be seen in the two charts above, there is a distinctive difference in the amount of 7’s feedbacked by the students between the performance chart and the importance chart. | There are many aspects in which the library should consider to revamp. Or reflect on their processes so as to increase their performance score. |
| S/N | Insights | Recommendations |
|---|---|---|
| Most notably, we can see that the worst scored measure of the Library is that students cannot find a place in the library to work in a group when they need to. This is exemplified by the 753 respondents that rated it at a value of 1, the lowest value. Furthermore, there is no score higher than 5. Since it is seen that 7,693 undergraduates view this as the 3rd most important services the school library can offer, this is an issue that should be of high priority. | SMU Library can do improvements to the library so as to increase undergraduates ability to find a place to do group work. This can be done through increasing the number of group study rooms and increase the area for collaboration. |
| S/N | Insights | Recommendations |
|---|---|---|
| The second most top important area of concern for Undergraduates that are relevant is to find a quiet place to study in the Library. This is shown by the whopping 10,031 response of the maximum value that can be given. Yet the performance of that evaluation is sub-par and not even reaching a score of 6 and above. Therefore, this should be an issue of high priority to SMU library. | SMU should increase the capacity of its libraries by adding and introducing more equipment such as tables and chairs to accommodate more students. There should also be a consideration to find a more effective use of space of the library so as to maximise the amount of students that can fit inside the library. |
| S/N | Insights | Recommendations |
|---|---|---|
| The above two graph represent the performance evaluation by undergraduates based on the library. It can be seen that there is not much of a difference in terms of performance between Kwa Geok Choo Library and Li Ka Shing Library. | - |
Postgraduate Students
| S/N | Insights | Recommendations |
|---|---|---|
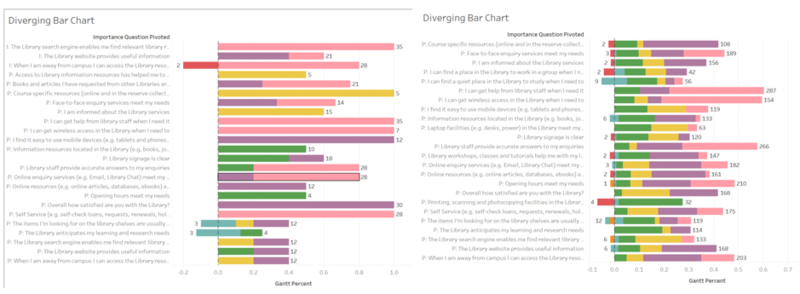
| Generally, it can be seen that Postgraduate students tend to view the library in a more optimistic light. In almost all of the importance and performance evaluations, there is a sizeable amount of a highest value response. | - |
]
| S/N | Insights | Recommendations |
|---|---|---|
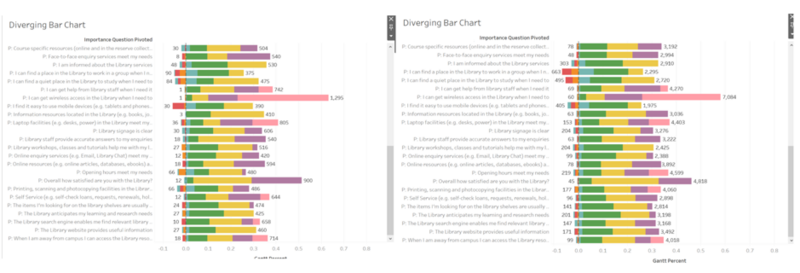
| One unique trait that Postgraduate students display is that they evaluated Li Ka Shing Library to have more better performance than Kwa Geok Choo Library. This can be seen in the two graphs above, one depicting the performance evaluation for Kwa Geok Choo Library and the other depicting the performance evaluation for Li K a Shing Library. | SMU can take notes to improve Postgraduate resources at Kwa Geok Choo Library. Perhaps there are resources that are available in Li Ka Shing library but not at Kwa Geo Choo Library. By identifying the evaluation subjects SMU can focus on key areas for improvement so as to increase the performance evaluation. |
Faculty
Based on the dashboard we can find some notably interesting results.
| S/N | Insights | Recommendations |
|---|---|---|
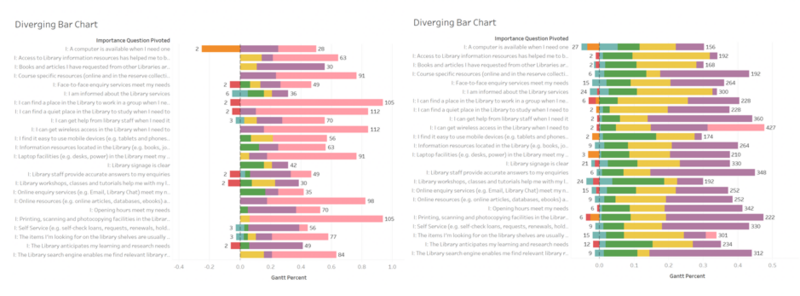
| There is one outstanding result of performance differing from its respective importance. The evaluation criteria for this is the “Printing, scanning and photocopy facilities in the Library”. In the survey results, there seems to be a large consensus for faculty that it is very important (as can be seen with the 105 response of the maximum value given). However the evaluation for its performance seems to be only sub-par with a maximum score given of 4 and even some 1 was given. This can be seen in contrast to the other respondent group of Undergraduates and Postgraduates. | SMU should take note to improve their printing facilities in both libraries. The disparity of the performance evaluation between the Faculty and Undergraduates with Postgraduates could be due to a possible reason. The printing services could not be friendly to Faculty and hence would result in this findings. SMU Libraries should find a way to introduce more features or to even help faculty members do their printing in a more seamless manner. |
| S/N | Insights | Recommendations |
|---|---|---|
| In the two pictures above we can see that there is a stark difference between the respondents for Kwa Geok Choo Library and Li Ka Shing Library. However there is no large standard deviation in terms of survey results in Kwa Geok Choo Library compared to Li Ka Shing Library. This result could be bias due to the number of respondents however we must not leave out the fact that Kwa Geok Choo Library has been performing much better than Li Ka Shing Library. | Li Ka Shing library should try and improve its services across all evaluation criterias. This will allow them to increase homogeneity in performance ratings. |
| S/N | Insights | Recommendations |
|---|---|---|
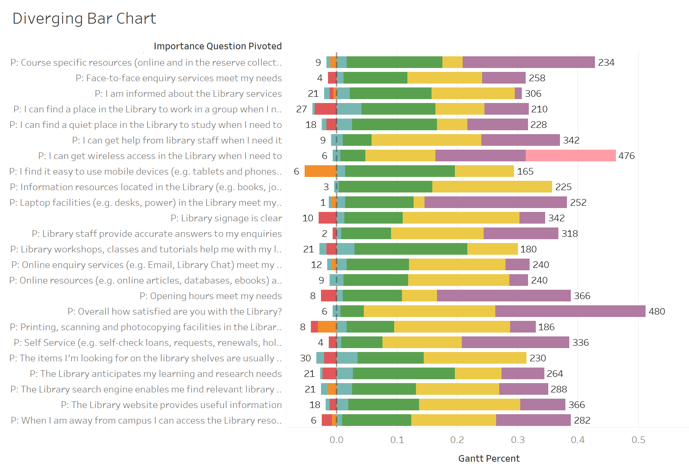
| One interesting point to note for Faculty is that the only evaluation that has a survey response of 1 is the evaluation criteria “When I am away from Campus I can access the Library resources”. This shows that there is a group of Faculty members that don’t view this as important or non-essential to their daily lives. | - |
Staff
| S/N | Insights | Recommendations |
|---|---|---|
| One interesting insight for the respondent “Staff” is that there is only a single performance evaluation criterion that scored a 7. The evaluation criteria is “I can get wireless access in the Library when I need to”. There could be a couple of reasons to as why the results show this. Firstly, it could be that the “Staff” respondents are more restrictive in their evaluation in the sense that they will only award a 7 in the case where it is excellent. Another reason could be that the respondent “Staff” have higher expectations of what a facility like the SMU library should offer. | I would recommend that SMU Library should try and engage some of these respondents and query them with regards on how they can improve their score. As the respondent type is “Staff”, they could have a much more constructive feedback in the perspective of a management so as to help improve the SMU Library for other user types as well. |
| S/N | Insights | Recommendations |
|---|---|---|
| One glaring insight to the respondents of “Staff” is that most of the positive results are skewed towards Kwa Geok Choo Law Library and not Li Ka Shing Library. As can see in the two graphs above, Kwa Geok Choo Library has more respondents that rated the importance of the evaluation criteras as 7. While Li Ka Shing Library seems to have only 2 importance of the evaluation critera rated as 7. This could possibly mean that the respondent type “Staff” would much prefer to visit or expect that Kwa Geok Choo Library should perform in its respective evaluation criterion to the best of its abilities. | SMU should focus Staff centric equipment or facilities more in Kwa Geok Choo Library. This is because the evaluation criteria in Kwa Geok Choo Library is deemed more important than the criterion in Li Ka Shing Library. |
Conclusion
By conducting this survey, we are able to gather insights into the different users of SMU libraries. In order to fully utilise the data, SMU should act on the insights that are generated by this survey results.


