SMT201 AY2019-20G1 EX2 Jessica Low Hui Chen
Contents
Part One: Gombak Maps
Gombak Roads
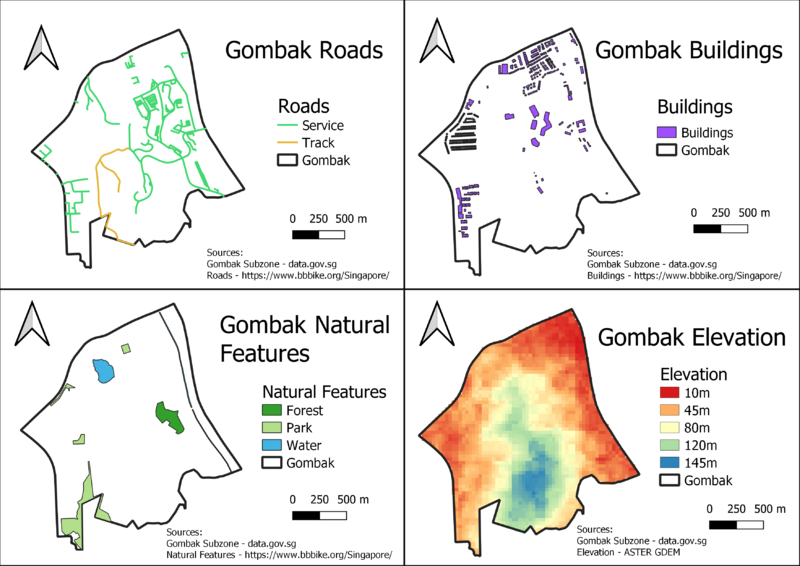
The criteria for the quarantine site selection involved studying the proximity to service roads & tracks for ease of construction. These 2 road types were identified and filtered for further study. These roads are well spread out across the whole Gombak subzone.
Gombak Buildings
On comparing the buildings with the addresses & street view on Google maps, I realised a vast majority of the buildings were either residential, commercial-based or have high throughput of individuals on a regular basis, such as places of worship or childcare centres). The quarantine centre's proximity to these areas also carry a high risk to the population, hence I decided to include all buildings into my analysis. The buildings generally occupy the western, northern & central areas of Gombak, with very few of them in the south & southeast.
Gombak Natural Featues
3 kinds of natural features exist in Gombak -- Forests, parks & water bodies -- which are all distinctly shown on the map. These areas are located near the eastern, northwestern & southwestern periphery of the subzone. The southwestern regions of Gombak are devoid of such natural features.
Gombak Elevation
Gombak's highest areas lie in its southern region (blue & green); the elevation decreases radially from there and gentles into low elevations nearer to the other edges of the subzone (orange & red).
Part Two: Proximity Maps
Part Three: Proximity Criterion Maps
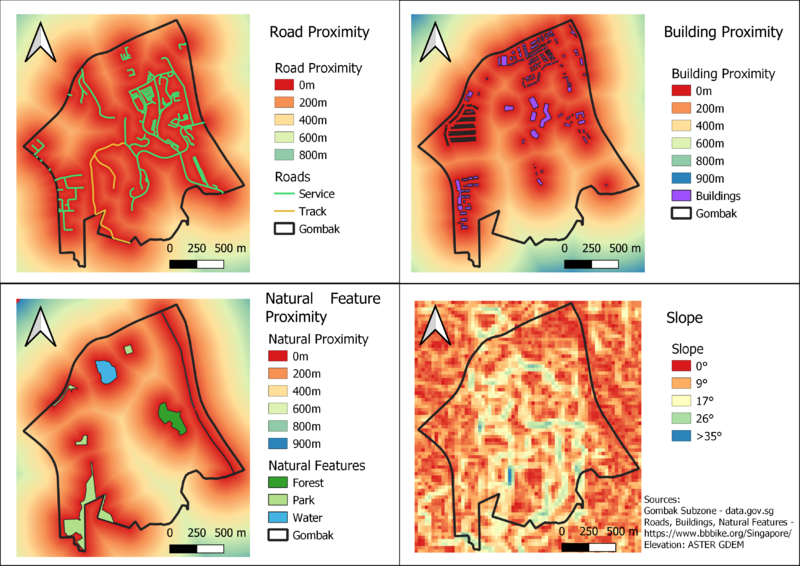
I standardised the proximity & slope using the min-max method. The formula is as follows: (X - min) / (max - min).
The map layer looks exactly the same as in Part 2, as standardisation does not change the underlying distrubtion, but insteadputs everything on the same scale (0-1) for easy comparison of variables with very different ranges.
Standardised Proximity Maps
The warmer the colour on the colour scale, the closer the distance an area is to a road/building/natural feature.
Standardised Slope
The warmer the colour on the colour scale, the gentler the slope.


