SMT201 AY2019-20G1 EX2 Jessica Low Hui Chen
Contents
Part One: Gombak Maps
Gombak Roads
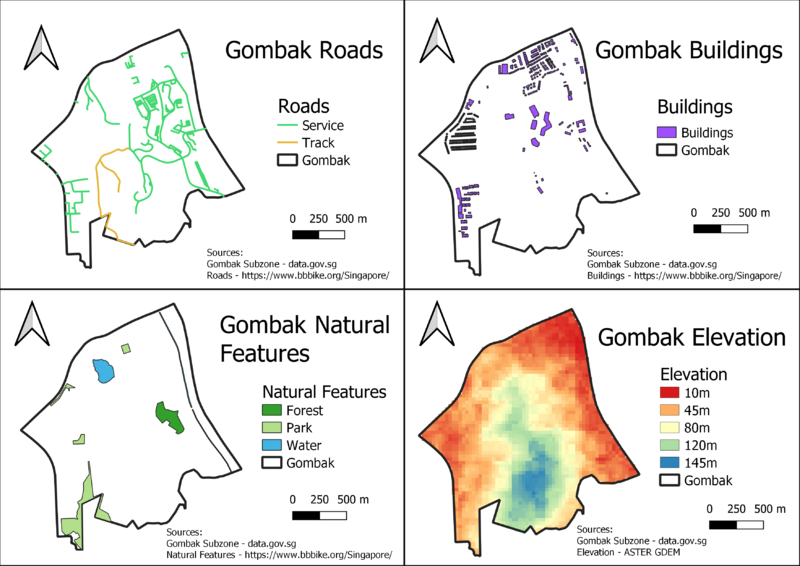
The criteria for the quarantine site selection involved studying the proximity to service roads & tracks for ease of construction. These 2 road types were identified and filtered for further study. These roads are well spread out across the whole Gombak subzone.
Gombak Buildings
On comparing the buildings with the addresses & street view on Google maps, I realised a vast majority of the buildings were either residential, commercial-based or have high throughput of individuals on a regular basis, such as places of worship or childcare centres). The quarantine centre's proximity to these areas also carry a high risk to the population, hence I decided to include all buildings into my analysis. The buildings generally occupy the western, northern & central areas of Gombak, with very few of them in the south & southeast.
Gombak Natural Featues
3 kinds of natural features exist in Gombak -- Forests, parks & water bodies -- which are all distinctly shown on the map. These areas are located near the eastern, northwestern & southwestern periphery of the subzone. The southwestern regions of Gombak are devoid of such natural features.
Gombak Elevation
Gombak's highest areas lie in its southern region (blue & green); the elevation decreases radially from there and gentles into low elevations nearer to the other edges of the subzone (orange & red).
Part Two: Proximity Maps
Proximity Maps
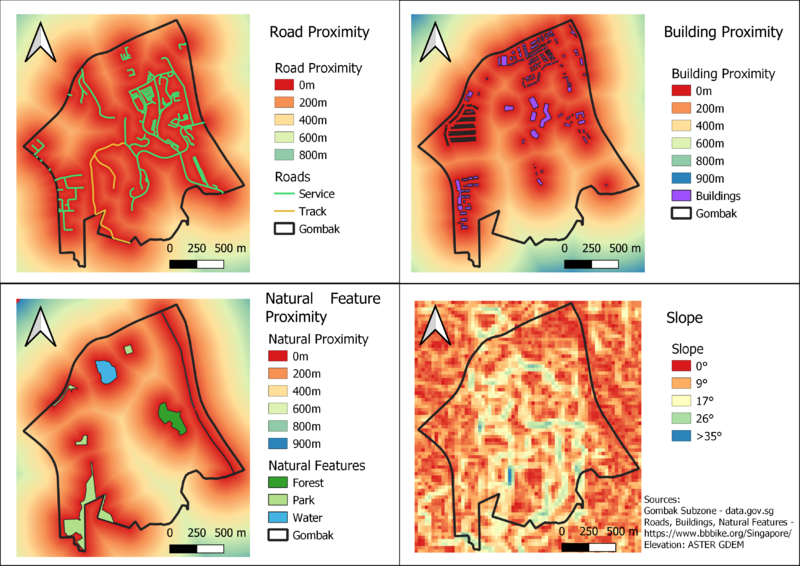
To derive the proximity maps, I first rasterised the road, building & natural feature layers respectively. Thereafter, I analysed the raster by proximity to the aforementioned raster layers.
The result -- warmer colours (red & orange) indicate close proximity to a road/building/natural featue, while cooler tones (greens & blue) indicate a further distance from said features.
The colours were standardised across all 3 maps to allow for easy comparison across diagrams.
Slope
The slope was calculated via slope raster analysis of the layer mentioned in Part 1 (from ASTER GDEM). Warm colous (red & orange) indicate gentle slopes, while cooler tones (yellow, green & blue) indicate steeper slopes. The steeper slopes seem to be clustered around central Gombak, while the endges of the subzone have gentler slopes.
Part Three: Proximity Criterion Maps
I standardised the proximity & slope using the min-max method. The formula is as follows: (X - min) / (max - min).
The map layer looks exactly the same as in Part 2, as standardisation does not change the underlying distribution, but instead puts everything on the same scale (0-1) for easy comparison of variables with very different ranges.
Standardised Proximity Maps
The warmer the colour on the colour scale, the closer the distance an area is to a road/building/natural feature.
Standardised Slope
The warmer the colour on the colour scale, the gentler the slope.
Part Four: Analytical Hierarchical Process
I ranked the 4 factors in the following order of importance:
- Health risk
- Accessibility
- Economic considerations
- Natural conservation
Health risk is the most important feature, as a quarantine centre's main purpose is to prevent disease transmission. Having a low health risk will thus render the centre useless.
Accessibility & economic considerations were ranked very similarly, though I placed slightly more importance on accessibility as I was thinking of long-term utilisation of the quarantine centre. Economic considerations of developmental costs are a short-term thing, whereas having greater accessibility both during & after construction will allow workers to travel to & fro with ease.
Natural conservation ranked last, since there are few natural features within Gombak. In addition, this aligns with the Singaporean government's stance of prioritising economic considerations over environmental preservation.
Part Five: Suitability Analysis
I utilised the following formula to create the suitability analysis raster: ((1 - "Road_Recoded@1") * 0.1284) + ((1 - "Slope_Recoded@1") * 0.2527)+ ("Buildings_Recoded@1" * 0.5710) + ("Natural_Recoded@1" * 0.0478)
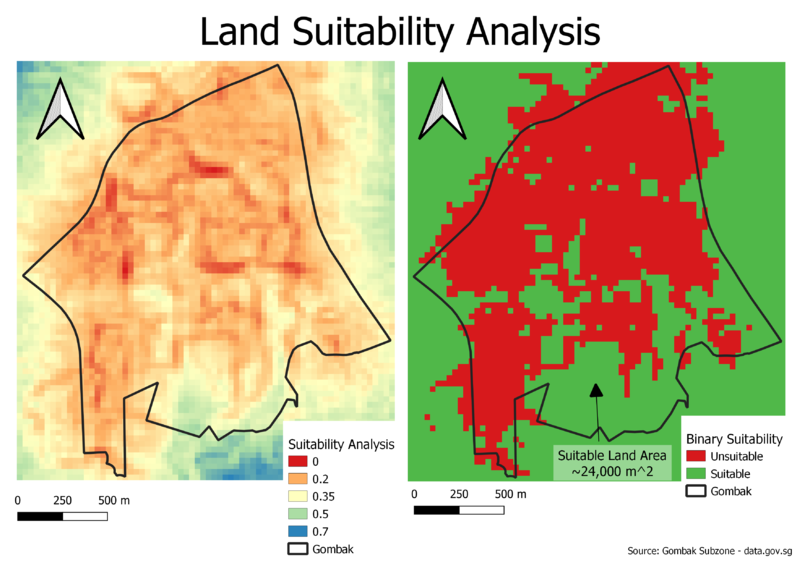
Thereafter, I reclassified the raster to have binary values - areas with suitability of <0.4 (unsuitable for the quarantine site) & ≥0.4 (suitable for the quarantine site).
There is one suitable plot of land greater than 10,000 m^2 for the construction of the quarantine site, lying at the southernmost border of Gombak. It has a contiguous area of ~24,000 m^2.
I recommend building it towards the inner part of the suitable plot layer, as this study did not take into account the border regions' proximity to buildings, roads & natural features outside the subzone. In particular, should any buildings lie in the close vicinity to the southernmost edge of Gombak, building the quarantine centre there will expose residents to undue harm.


