SMT201 AY2019-20G1 Ex2 Yiap Mei Lin Andrea
Revision as of 15:36, 9 November 2019 by Andrea.yiap.2018 (talk | contribs)
Contents
Part 1: Map layouts of Gombak planning subzone
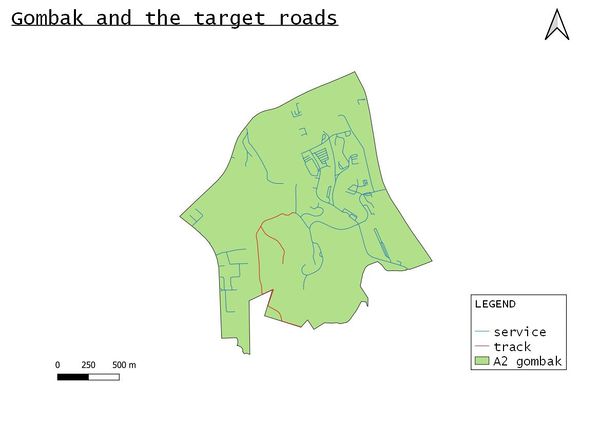
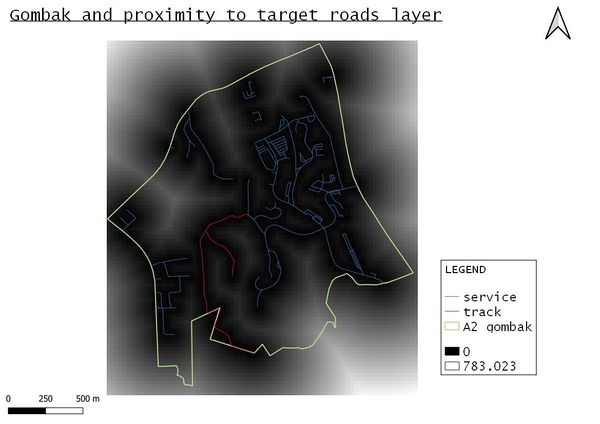
with target roads
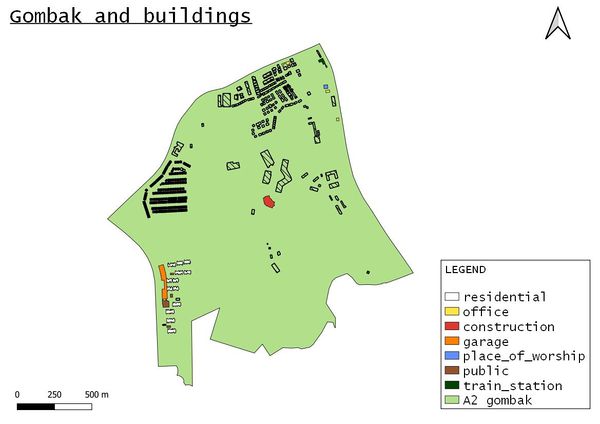
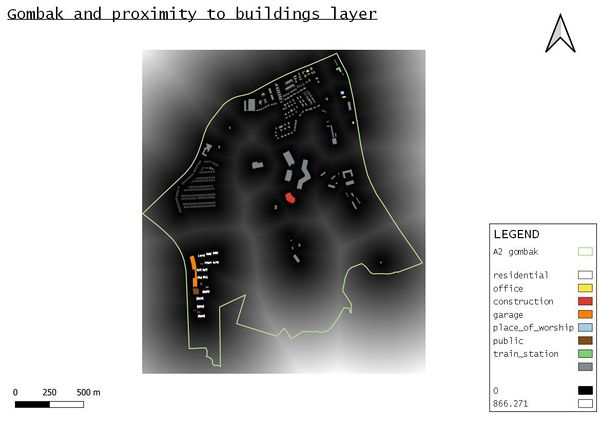
with buildings
For buildings, I grouped these as offices
- "Bukit Panjang Khek Community Guild"
- "Galisian Family Service Centre",
- "Lee Huat Motor Co" and
- "Econ Medicare Centre"
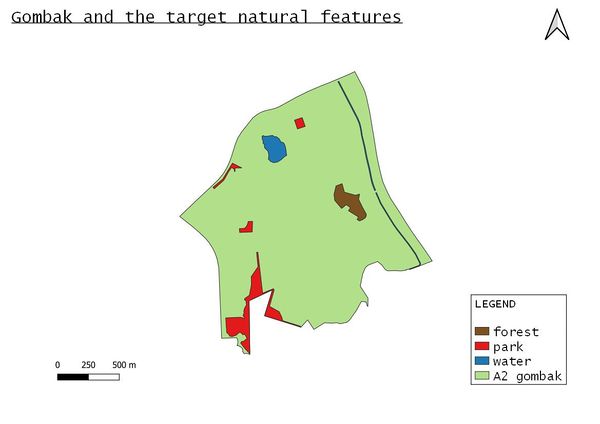
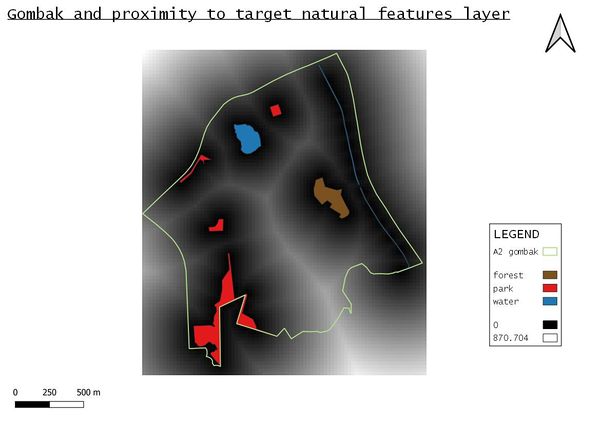
with target natural features
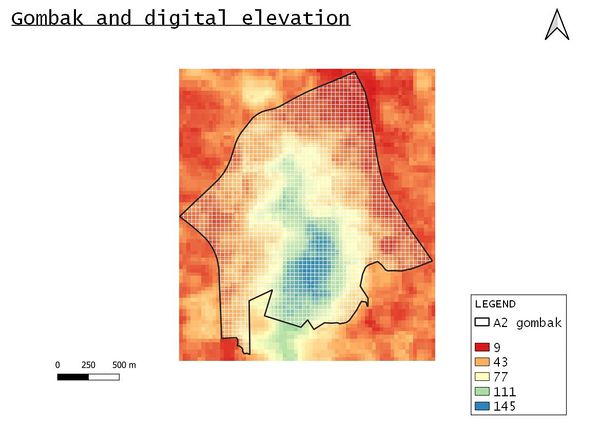
with digital elevation
Target roads layer proximity
Buildings layer proximity
Target natural features layer proximity
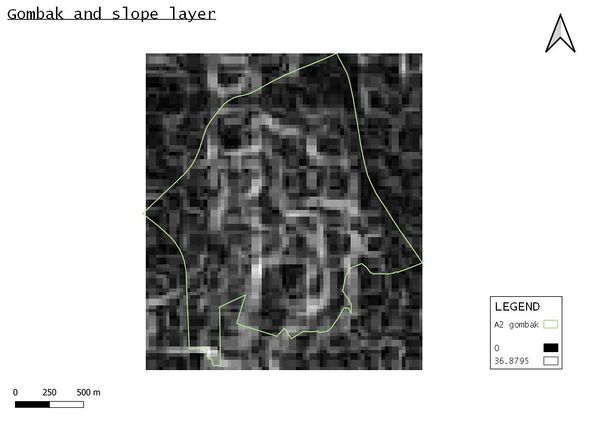
with slope layer
Part 2: Criterion scores of each factor layers
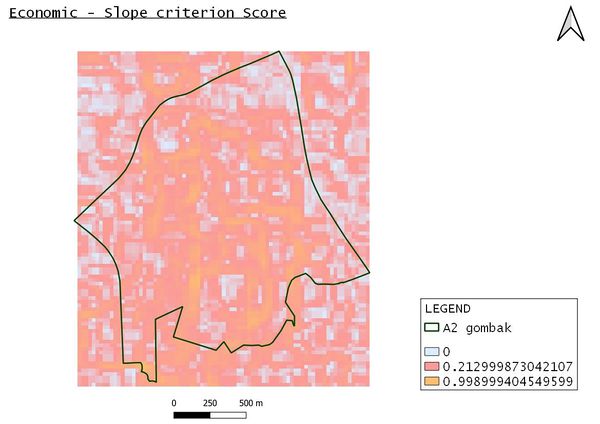
Economic Factor
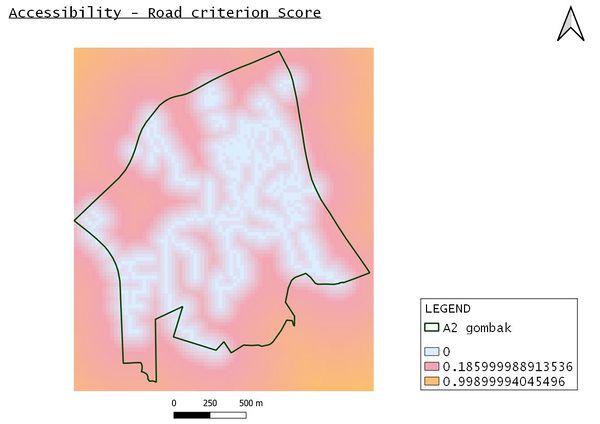
Accessibility Factor
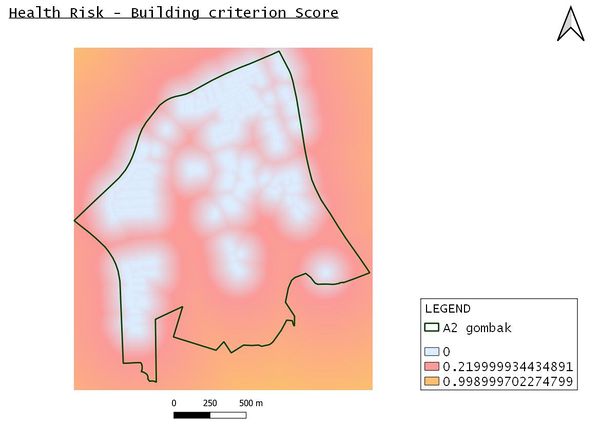
Health risk Factor
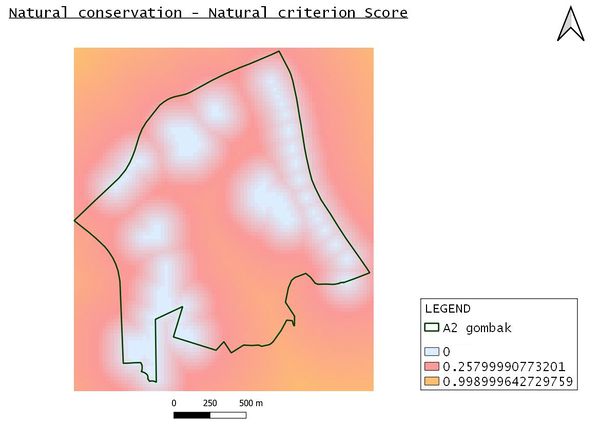
Natural conservation Factor
Part 3: Analytical Hierarchical Process input matrix and result report
From the result, it shows that the consistency index is within the acceptable range of 10% or less. According to the percentage output, this is how I view which has the most importance (the higher, the more important):
- Health Risk
- Accessibility
- Economic
- Natural conservation
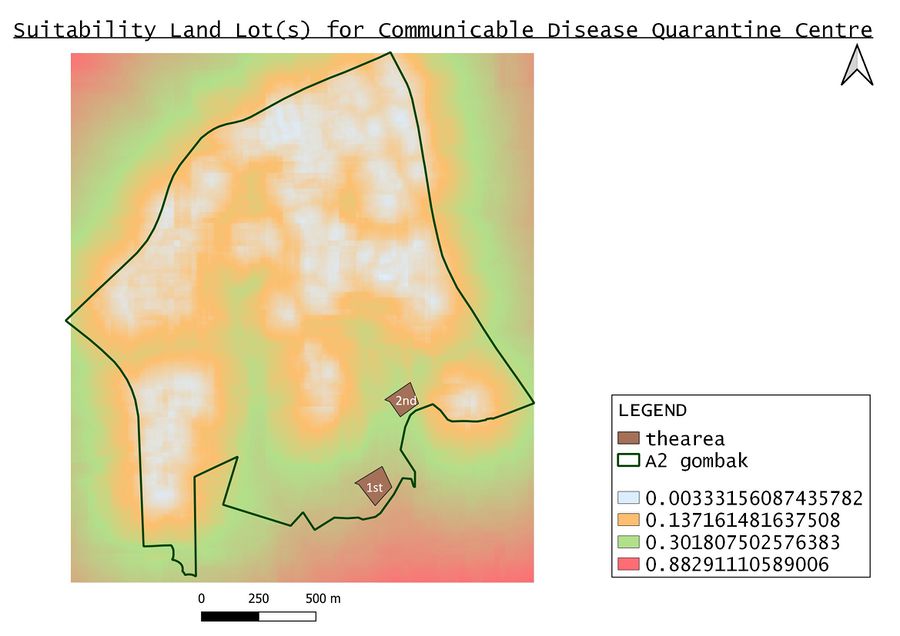
Part 4: Suitability Land Lot(s)
