SMT201 AY2019-20G1 EX1 Ng Xun Jie
Revision as of 23:28, 15 September 2019 by Xunjie.ng.2018 (talk | contribs)
Part 1: Thematic Mapping
Distribution of public education institution by school types
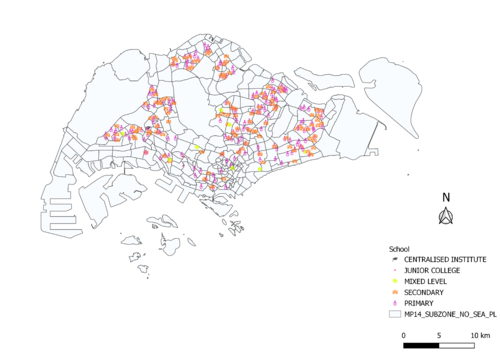 Using the Pin Map to map out the distribution of public education will allow us to see the discrete data points on the map more vividly. By changing the Symbol Layer, employing relevant SVG marker to indicate different level of the educational institution, and giving different sizes to the different level of the educational institution, we will be able to identify the necessary school better.
Hierarchy of Road network system of Singapore

