SMT201 AY2019-20T1 EX1 Goh Jia Xin Genice
Revision as of 15:52, 15 September 2019 by Genice.goh.2018 (talk | contribs) (→Aged Population (65+) in 2010 and 2018)
Contents
Part 1: Thematic Mapping
Part 2: Chloropeth Mapping
Aged Population (65+) in 2010 and 2018
Description
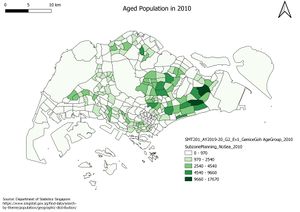
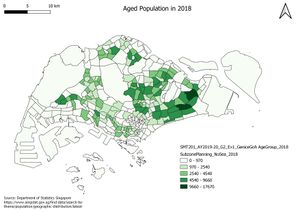
These maps show the spatial variation of aged population (65 and above) across Singapore in 2010 and 2018 respectively. The increase in the number of subzones which are coloured with a greater intensity of green from 2010 and 2018 evidently shows that the number of Singapore Residents who are aged 65 and above is on the rise.
===Proportion of Aged Population (65+) in 2010 and 2018)


