SMT201 AY2019-20T1 EX1 Goh Jia Xin Genice
Part 1: Thematic Mapping
Part 2: Chloropeth Mapping
Aged Population (65+) in 2010
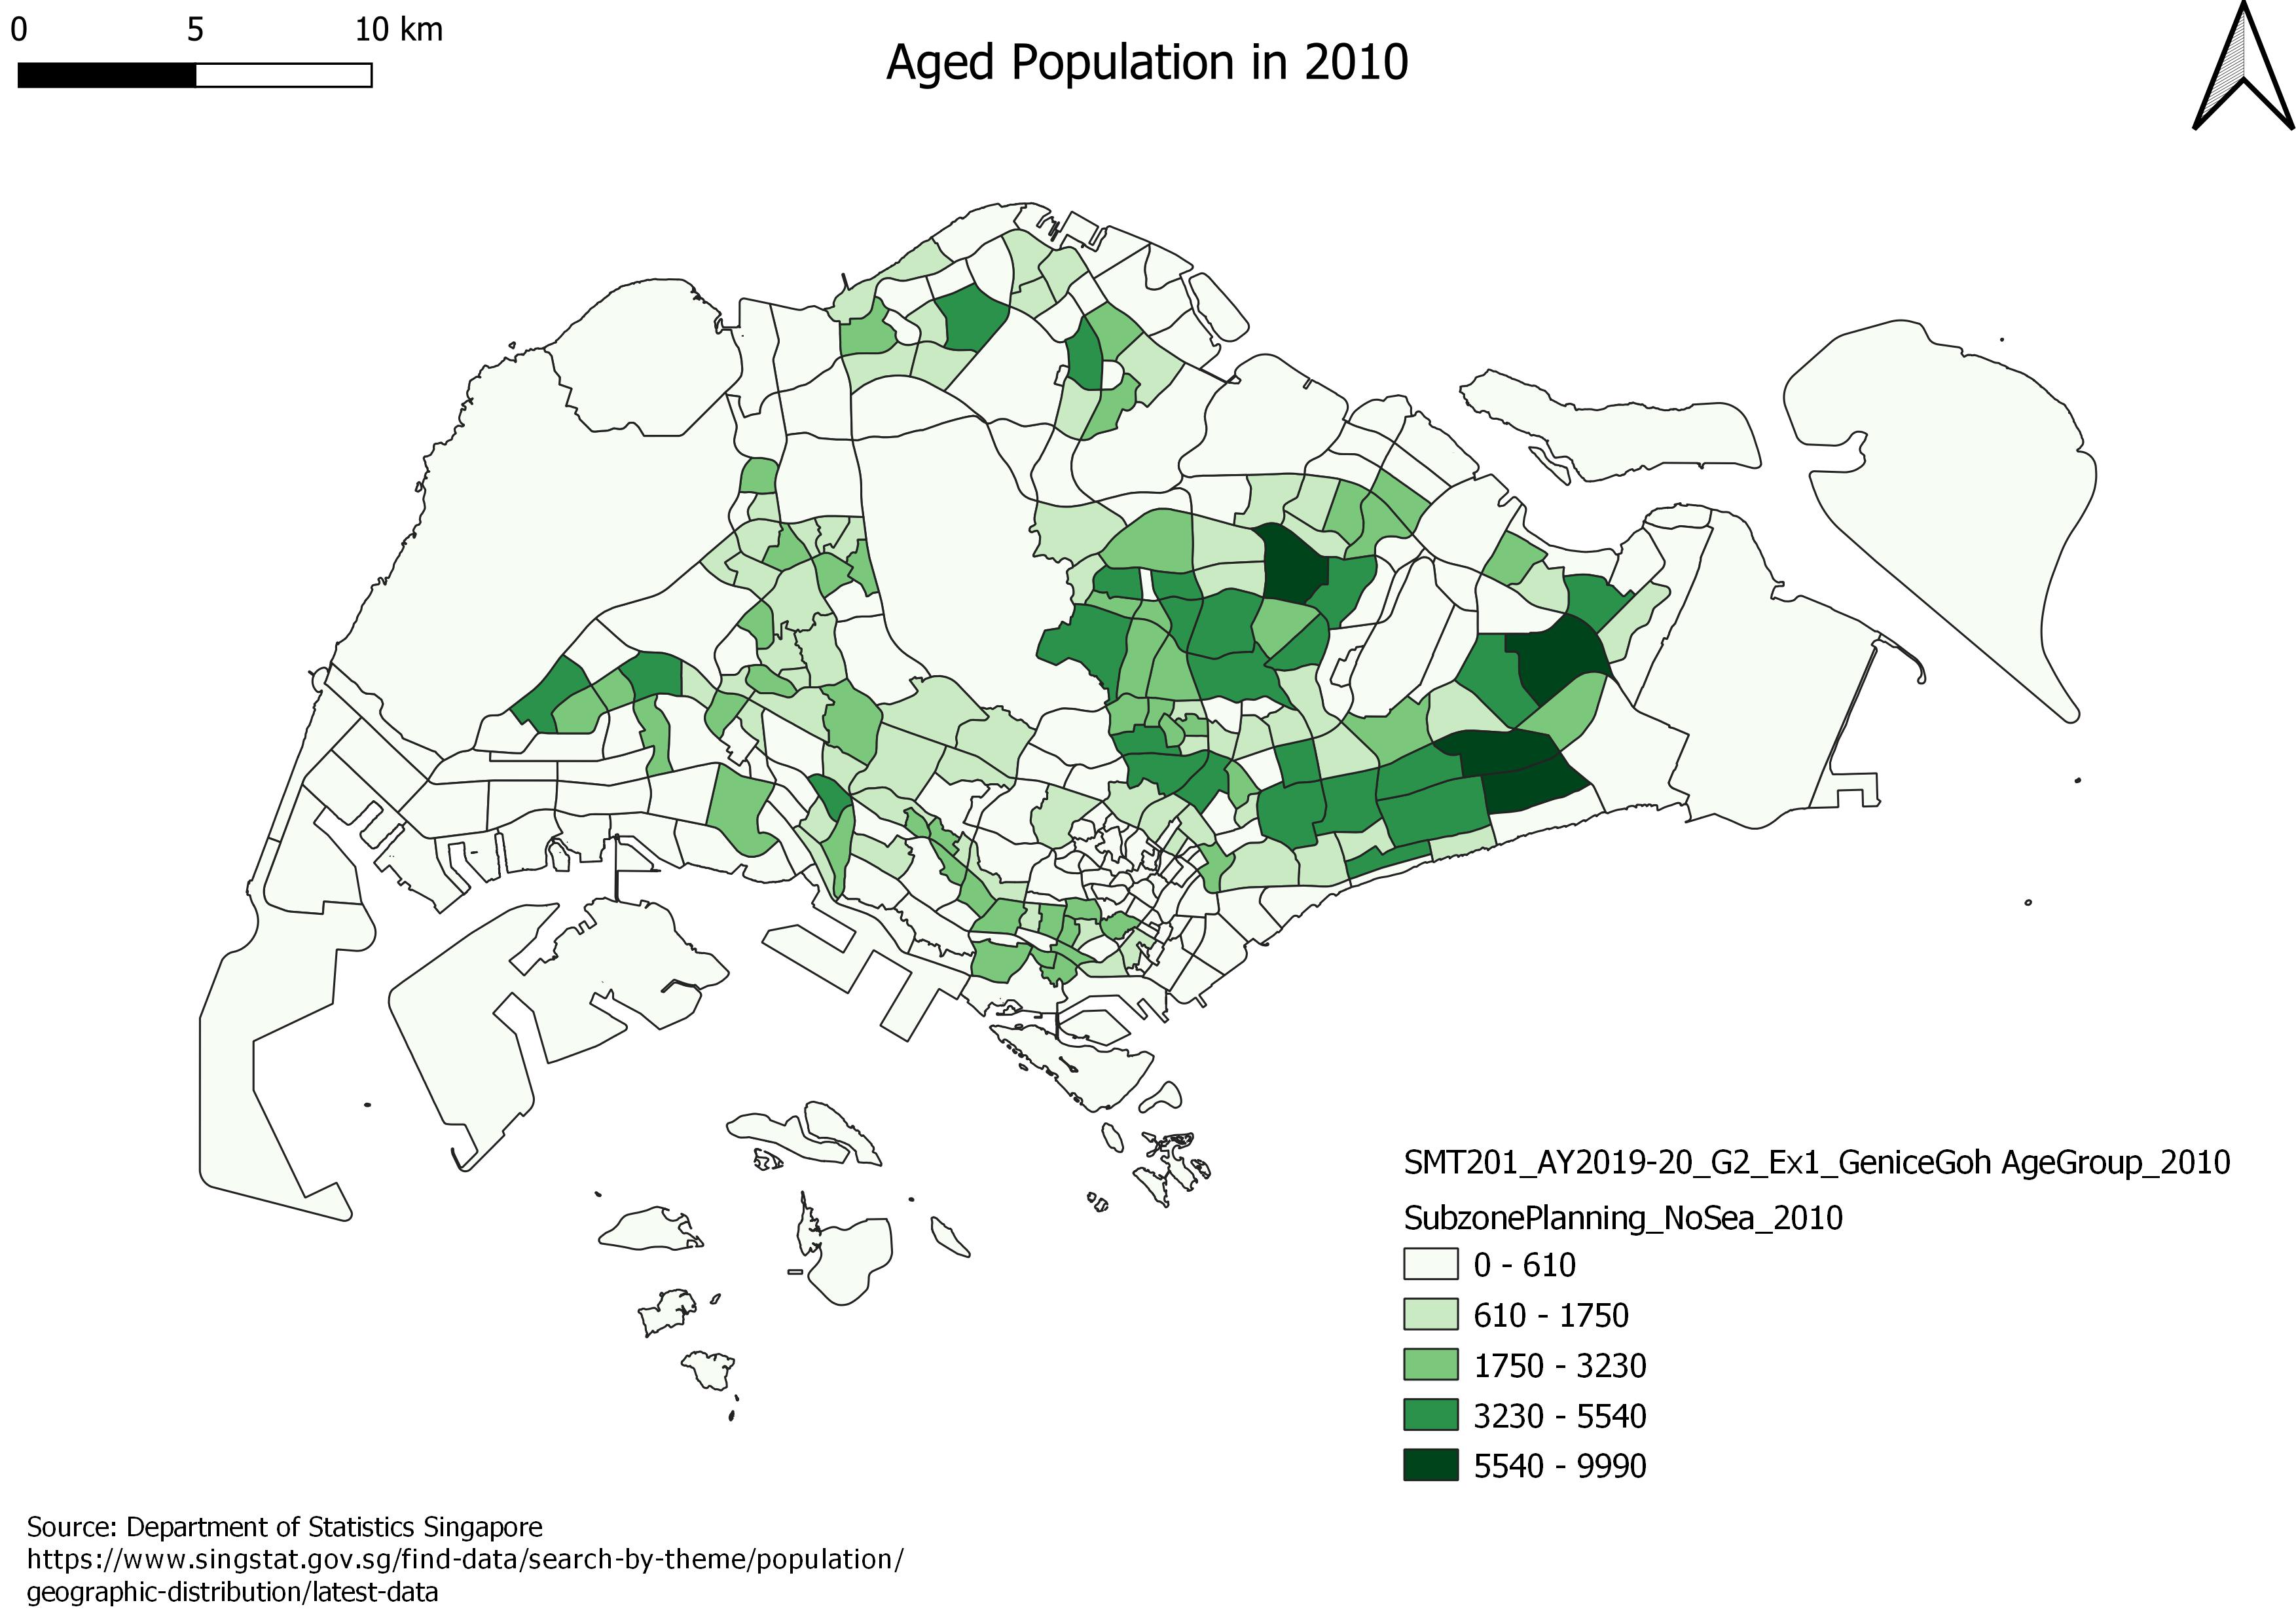
This map shows the spatial variation of aged population across Singapore in 2010. It is evident that there is a greater number of people who are aged 65 and above in the Eastern Region of Singapore, as shown by the darker coloured areas on the map.
I firstly extracted the 2010 Age Group Data from the master file ‘SGPopulationAgeGroupSex’ obtained from Data.gov.sg and cleaned it. I joined the cleaned data with the 2008 Subzone Planning Map and created a new variable called Aged65+, which calculates the number of Singapore Residents who are aged 65 and above. The rationale for using the 2008 Subzone Planning Map is because some of the subzones in the 2010 Age Group Data do not exist in the 2014 Subzone Planning Map. Afterwards, I used graduated categorisation using the variable Aged65+ to create this map.
