SMT201 AY2019-20T1 EX1 Zang Yu
Part 1: Thematic Mapping
Distribution of public education institution by school types
Since the nature of the data is discrete, I have categorised the school layer into 4 categories based on the school types and symbolise them using different svg symbols. I used MP14 planning area layer as the background reference map to show the distribution of public education institutions across Singapore.
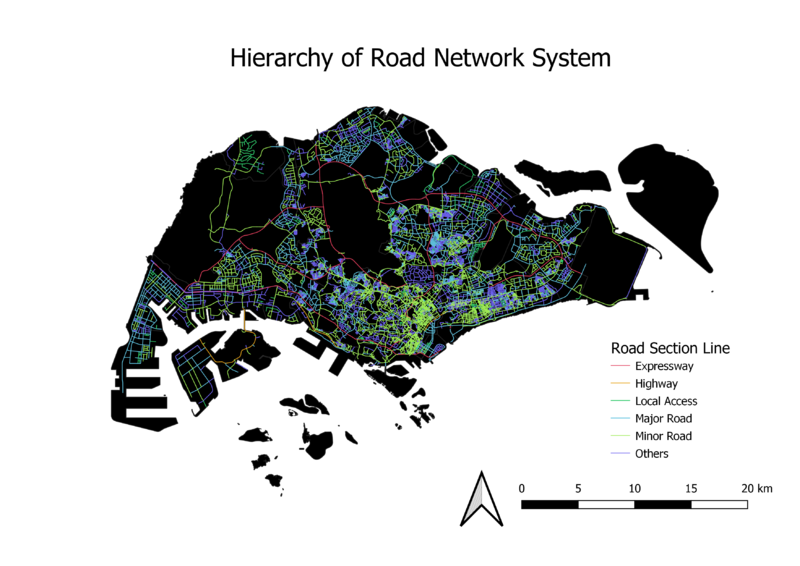
Road network system of Singapore
Based on the data from road section layer we could not distinguish the major roads and minor roads. Therefore, I joined road section layer with national map line layer as information about expressways and major roads can be retrieve from the national map line layer. The rest of the roads I assumed they are minor roads. After categorised the road network into different types of road, I used lines with different colours and thickness to represent them.
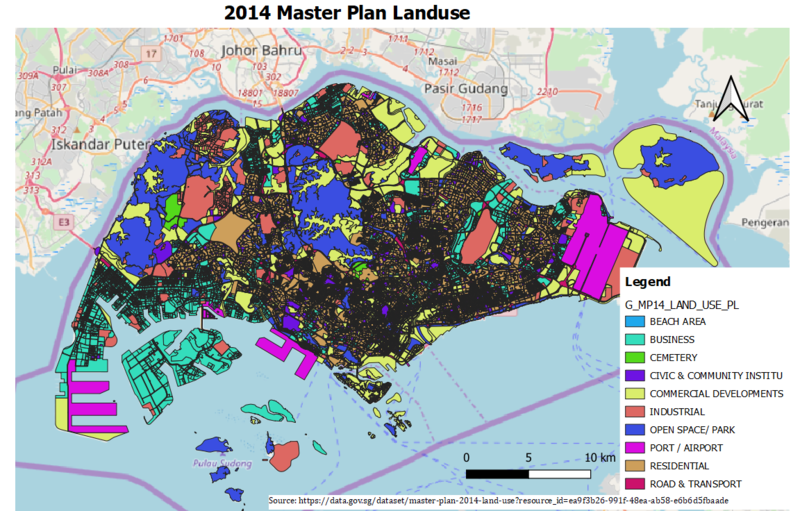
2014 Master Plan Landuse


