Jingyi LandSuitability
The weights obtained from the AHP analysis is used to combine all the 4 factor layers together using raster calculator.
In this case, the following formula is used and the land suitability map is generated as shown below.
[("Slope(Standard)@1"*0.052) + ("Roads(SProxi)@1"*0.263) + ("Buildings(SProxi)@1" * 0.584) + ("Natural(SProxi)@1" * 0.101)]
As shown in the land suitability map above, the potential sites with the highest suitability score (darker) is concentrated at the south side of Gombak.
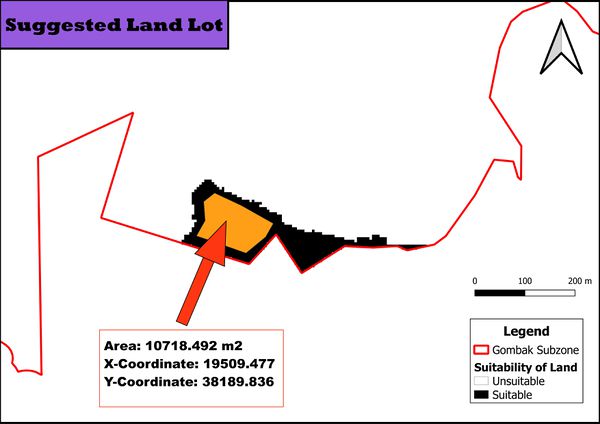
To make the area that have the highest suitability shown more clearly on the map, i decided to use the function "Reclassify by table" to extract out the area with the highest suitability. Areas with suitability score of less than 0.60 is eliminated in this case and only areas with the suitability score of more than 0.60 is kept.
The suggested land lot is shown above with an area of 10718.492m2 and centroid x and y coordinates of 19509.477 and 38189.836 respectively. This land lot is deemed suitable for construction of a quarantine centre as it is located away from the population, accessible to roads, away from most natural features. However, the land lot do have relatively steep surface and more cost would need to be incurred during development of the quarantine centre.
Additional Notes:
Limitation of Analysis: This suggested land lot may not be the most suitable land lot to build a quarantine centre at as it is located at the edge of Gombak. Since our analysis only covered area in Gombak subzone and not the subzones next to gombak, there may be many buildings and natural features near the suggested land lot that may not be accounted for.


