Jingyi Criterion
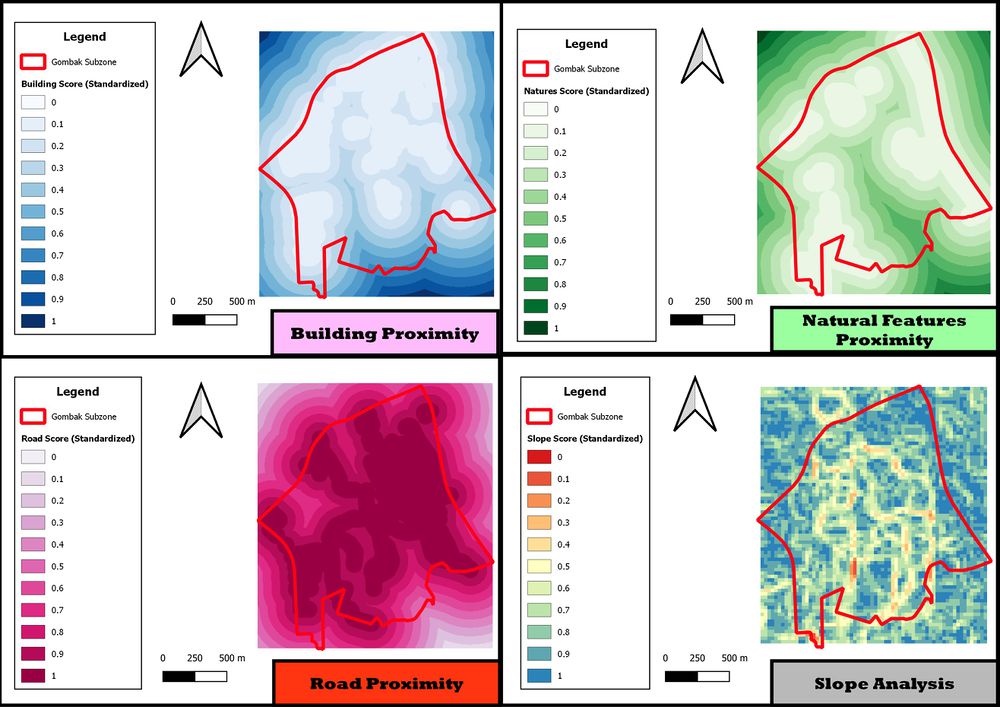
To make the analysis of proximity easier and more accurate, the proximity of the results obtained need to be standardized.
A higher score (darker blue) indicates a higher suitability of the potential sites in term of health risk factor, this mean that sites with higher score is further away from buildings than sites with lower score and is more suitable for construction of a quarantine centre as these sites have lower risk of disease spreading.
A higher score (darker green) indicates a higher suitability of the potential sites in term of natural conservation factor, this mean that sites with higher score is further away from natural features than sites with lower score and is more suitable for construction of a quarantine centre.
A higher score (darker pink) indicates a higher suitability of the potential sites in term of accessibility factor, this mean that sites with higher score is nearer to roads than sites with lower score and is more suitable for construction of a quarantine centre as these sites allows easier transportation of development materials during construction stage.
A higher score indicates a higher suitability of the potential sites in term of economic factor, this mean that sites with higher score is less steep as compared to sites with lower score and is more suitable for construction of a quarantine centre as less development will be incurred when constructed in these sites.
Additional Notes
I standardized the proximity of the results through the following steps:
- Normalize raster values to a range of 0 to 1 for all factor layers using raster calculator using the following standardization formula:
([Proximity- Min(Proximity)] / [Max(Proximity) - Min(Proximity)] [1] or 1 - ([Proximity- Min(Proximity)] / [Max(Proximity) - Min(Proximity)] [2]
The formula [1] is applied to buildings and natural features factors and formula [2] is applied to slopes and roads factors. This is to ensure uniform results of the criterion score, where higher score indicates higher suitability in all factors for construction of quarantine centre and vice versa.
- After normalizing and deriving the criterion score for each factor layer, I realized that the map is not clear in showing the suitability of the different factors. Therefore, I went a step further and use the function "Reclassify by table" to further standardize all the factor layers to make the analysis of proximity easier.
