File:2010 2018 Change.png
Revision as of 15:13, 15 September 2019 by Jessicalow.2018 (talk | contribs) (Jessicalow.2018 uploaded a new version of File:2010 2018 Change.png)

Size of this preview: 800 × 566 pixels. Other resolutions: 320 × 226 pixels | 3,507 × 2,480 pixels.
Original file (3,507 × 2,480 pixels, file size: 936 KB, MIME type: image/png)
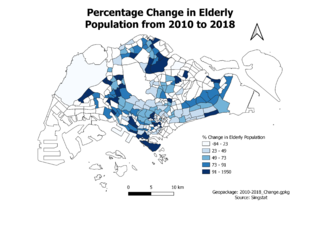
Choropleth map of distribution of percentage change of residents aged 65+ between 2010 & 2018
File history
Click on a date/time to view the file as it appeared at that time.
| Date/Time | Thumbnail | Dimensions | User | Comment | |
|---|---|---|---|---|---|
| current | 15:13, 15 September 2019 | | 3,507 × 2,480 (936 KB) | Jessicalow.2018 (talk | contribs) | |
| 22:38, 14 September 2019 |  | 3,507 × 2,480 (931 KB) | Jessicalow.2018 (talk | contribs) |
- You cannot overwrite this file.
File usage
The following page links to this file: