Difference between revisions of "SMT201 AY2019-20G2 Ex1 Lu Zhimao"
Jump to navigation
Jump to search
(Created page with "== Part One: Thematic Mapping == === 2014 Master Plan Landuse === === Level of Schools === === Road Network System === == Part Two: Choropleth Mapping == === 2010 Populat...") |
|||
| Line 4: | Line 4: | ||
=== Level of Schools === | === Level of Schools === | ||
| + | [[File:Education ex01.png|800px|center]] | ||
| + | In order to have a good distribution of public education institution, I have to check the csv file if there are any missing or incorrect data. If there is a need, I have to adjust accordingly. After checking the data, I choose to use geocode to upload the data in to QGIS instead of using MMGQIS. Using geocode is more suitable in Singapore context as it reduces the chance of missing datas. After that I chose to categorise them according their education level and assigned a unique colour or symbol to each type of data. I use whiteboard representing primary school, book representing secondary school and hat representing JC. As there are three different type of JCs, therefore I use 3 different colour hats to represent each type of JC. <br> | ||
=== Road Network System === | === Road Network System === | ||
Revision as of 23:07, 15 September 2019
Part One: Thematic Mapping
2014 Master Plan Landuse
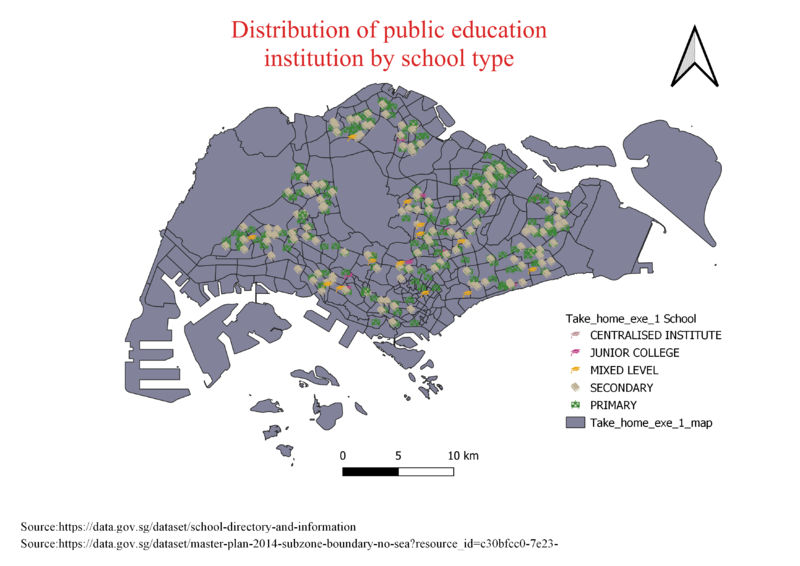
Level of Schools

In order to have a good distribution of public education institution, I have to check the csv file if there are any missing or incorrect data. If there is a need, I have to adjust accordingly. After checking the data, I choose to use geocode to upload the data in to QGIS instead of using MMGQIS. Using geocode is more suitable in Singapore context as it reduces the chance of missing datas. After that I chose to categorise them according their education level and assigned a unique colour or symbol to each type of data. I use whiteboard representing primary school, book representing secondary school and hat representing JC. As there are three different type of JCs, therefore I use 3 different colour hats to represent each type of JC.