Difference between revisions of "Three horrible guys Project Report"
| Line 27: | Line 27: | ||
<!--Content--> | <!--Content--> | ||
| + | |||
| + | ==<div style="background: #8b1209; padding: 15px; line-height: 0.3em; text-indent: 15px; font-size:18px; font-family:Helvetica"><font color= #FFFFFF>Network Analysis (Shortest Path)</font></div>== | ||
| + | <div style="font-family:Helvetica;font-size:16px"> | ||
| + | |||
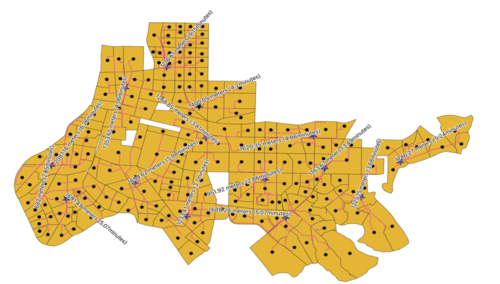
| + | We realized that for every map IFC provided in PowerPoint they have a node which indicated the travel time to each region. However, we realized that this time is only calculated with the main external road without taking into consideration that there were other roads within each Trade Area that can be utilized for travel time. We create centroids for each subzone that would provide a more accurate estimation of Travel Time for IFC. | ||
| + | |||
| + | [[File:q28.png|500px|center]] | ||
| + | <center>''Shortest Path''</center> | ||
| + | |||
==<div style="background: #8b1209; padding: 15px; line-height: 0.3em; text-indent: 15px; font-size:18px; font-family:Helvetica"><font color= #FFFFFF>Multivariate Regression Analysis</font></div>== | ==<div style="background: #8b1209; padding: 15px; line-height: 0.3em; text-indent: 15px; font-size:18px; font-family:Helvetica"><font color= #FFFFFF>Multivariate Regression Analysis</font></div>== | ||
Revision as of 19:36, 22 November 2019
Network Analysis (Shortest Path)
We realized that for every map IFC provided in PowerPoint they have a node which indicated the travel time to each region. However, we realized that this time is only calculated with the main external road without taking into consideration that there were other roads within each Trade Area that can be utilized for travel time. We create centroids for each subzone that would provide a more accurate estimation of Travel Time for IFC.
Multivariate Regression Analysis
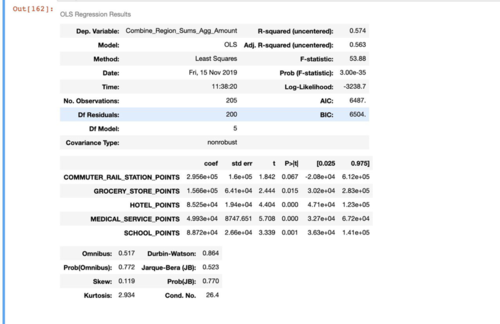
We performed Regression Analysis using the Ordinary Least Squares (OLS) method to identify any predictor factors that could be used to predict what point of interest can make an impact on the sales in the region.
Hotel, Medical Service and School points are common places one might order a food delivery service to. Hotels have guest who would like to order food in the comfort of their room. Medical Service points might have staff who are too busy to eat their meals, and thus order delivery in order to get food. Schools are full of students who snack and order pizza regularly. All these thus affecting overall sales of the store. However, Commuter Rail Station and Grocery Stores do not make much sense in the context of our model and require further analysis


