Three horrible guys Web Maps
Jump to navigation
Jump to search

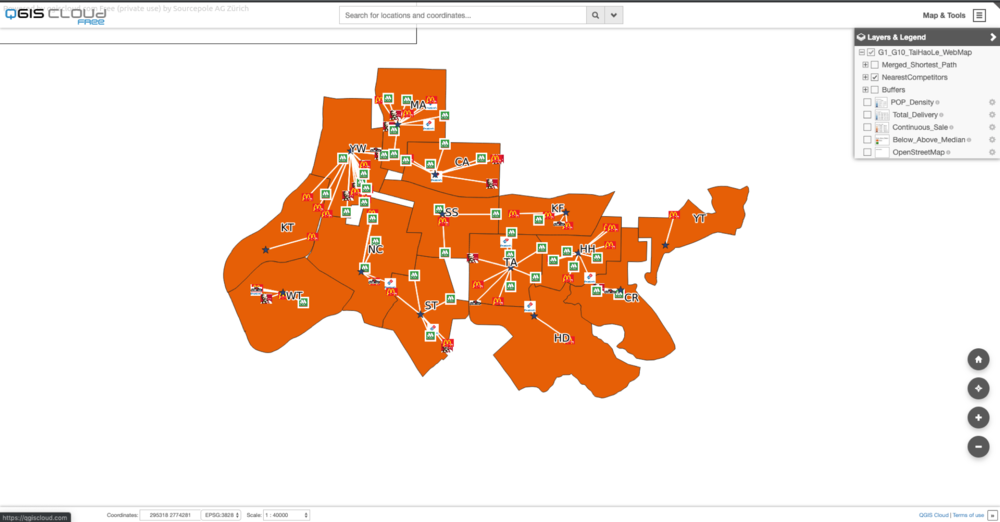

Click here for our web maps: https://qgiscloud.com/eugenechoy2016/G1_G10_TaiHaoLe_WebMap/
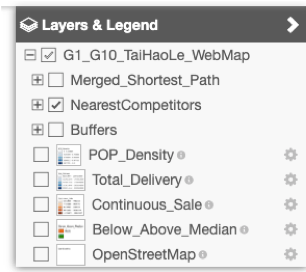
| Layer | Description |
|---|---|
| Merged_Shortest_Path | A map showing the shortest path from the store to the centroid |
| Nearest Competitor | A map that highlights the nearest competitor to each store |
| Buffers | A map showing a 500m and 1000m buffer for each store |
| POP_Density | A thematic map that shows normalized population density |
| Total_Delivery | A thematic map that shows delivery counts |
| Continious_Sale | A thematic map that shows total sales |
| Below_Above_Median | A thematic map that shows areas below/above the median sales |
| OpenStreetMap | A map used for background |
The web map is generated using QGIS Cloud [1]. QGIS Cloud is a plugin in QGIS which allows a free user to publish 1 Web Map with up to 50mb storage provided. This allow users to view the map through a map platform. If there is a need to show the web map on another website, an iframe can be used to embed the web map onto the website.

This is a view of how the map will look like on its hosted URL.

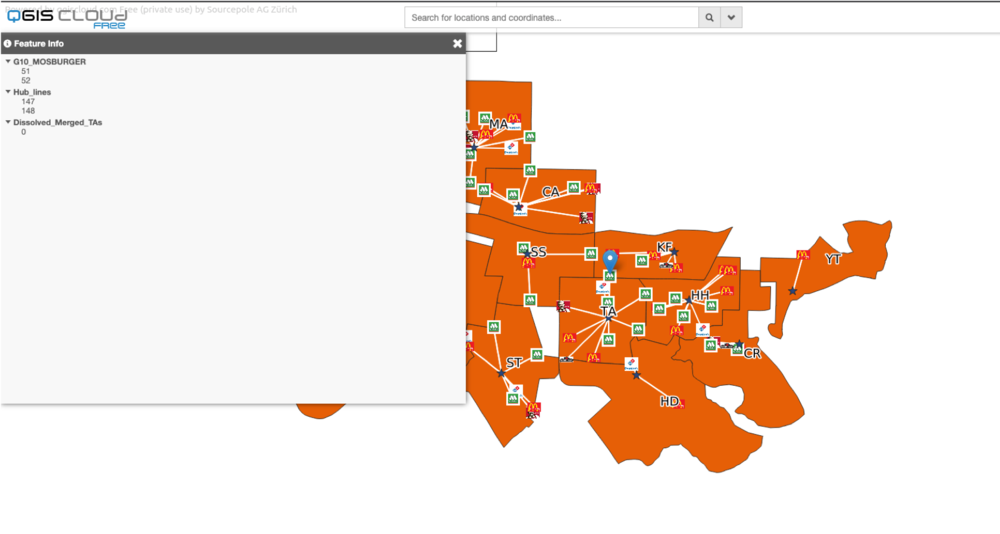
Users are able to interact with objects in the view to see more specific details of a specific point.

This can also show/hide various layers published on the web map