|
|
| Line 215: |
Line 215: |
| | </center> | | </center> |
| | |- | | |- |
| − | | <center> POIs </center>[[Image: A2.png |300px|center]] || | + | | <center> POIs </center>[[Image: A5.png |300px|center]] || |
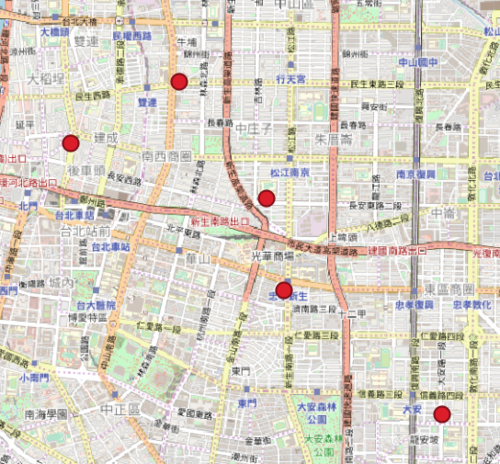
| | * The client provided us SHP files that contains information about each POI. We used 32 out of the 86 POI SHPs given. They are: | | * The client provided us SHP files that contains information about each POI. We used 32 out of the 86 POI SHPs given. They are: |
| | # ATM | | # ATM |
| Line 316: |
Line 316: |
| | </center> | | </center> |
| | |- | | |- |
| − | | <center> Competitor POI’s </center>[[Image: A2.png |300px|center]] || | + | | <center> Competitor POI’s </center>[[Image: A6.png |300px|center]] || |
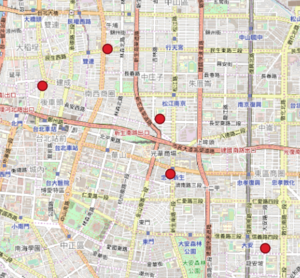
| | * The client also provided us SHP files that contains information about each individual store from 5 clients. The data has the same attributes as POIs (refer to above), with an addition column: | | * The client also provided us SHP files that contains information about each individual store from 5 clients. The data has the same attributes as POIs (refer to above), with an addition column: |
| | <center> | | <center> |
| Line 329: |
Line 329: |
| | | | |
| | |- | | |- |
| − | | <center> Taiwan Road </center>[[Image: A2.png |300px|center]] || | + | | <center> Taiwan Road </center>[[Image: A7.png |300px|center]] || |
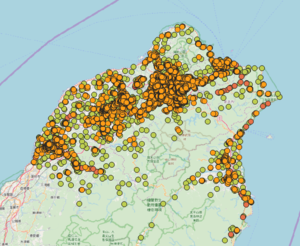
| | * We obtained Taiwan Road SHP files online and managed to get it from mapcruzin.com. This was used in our shortest path analytical task. | | * We obtained Taiwan Road SHP files online and managed to get it from mapcruzin.com. This was used in our shortest path analytical task. |
| | * Obtained from https://mapcruzin.com/free-taiwan-country-city-place-gis-shapefiles.htm | | * Obtained from https://mapcruzin.com/free-taiwan-country-city-place-gis-shapefiles.htm |
| Line 357: |
Line 357: |
| | | | |
| | |- | | |- |
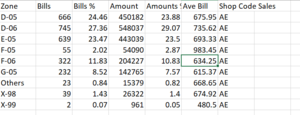
| − | | <center> Sales Data </center>[[Image: A2.png |300px|center]] || | + | | <center> Sales Data </center>[[Image: A8.png |300px|center]] || |
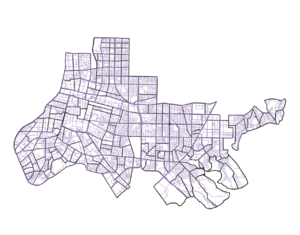
| | * The client gave us a CSV file containing yearly sales information of each region, further broken down into zone | | * The client gave us a CSV file containing yearly sales information of each region, further broken down into zone |
| | | | |
| Line 382: |
Line 382: |
| | | | |
| | |- | | |- |
| − | | <center> Population Data </center>[[Image: A2.png |300px|center]] || | + | | <center> Population Data </center> || |
| | * We obtained population data with regards to Taiwan online. The XLS file contains population Data is from the year 2010 and is in, uncleaned table format XLS. This was used as an addition feature in our analysis. | | * We obtained population data with regards to Taiwan online. The XLS file contains population Data is from the year 2010 and is in, uncleaned table format XLS. This was used as an addition feature in our analysis. |
| | * Obtained from https://census.dgbas.gov.tw/PHC2010/english/rehome.htm | | * Obtained from https://census.dgbas.gov.tw/PHC2010/english/rehome.htm |
Back to Project Home
Introduction & Motivation
International Food Chain (IFC) is a leading brand in its sector, with over 18000 outlets worldwide and an ever-growing presence in the global market. In Taiwan alone, IFC has over 240 branches and are constantly expanding.
However, as the franchise grows bigger, so does its challenges. One of the challenges involves the lack of a geographical analysis to efficiently compare the performance of each chain to one another.
Leveraging on this fact, our group aims to digitalise the data and conduct in-depth analysis on each branch. We hope to track the performance of each chain in relation to Point-Of-Interests surrounding each chain, uncovering and comprehending phenomena, with the aid of spatial data.
This project was made in tandem with: https://wiki.smu.edu.sg/1920t1is428g1/Two_Eyes_One_Pizza
Objectives
This project aims to provide insights into the following:
- Missing Areas in trade zone
- Number of POIs surrounding each store
- Store performance with regards to sales
- Delivery Information
- Population Density
- Buffer and proximity
- Nearest Competitors to store
- Variable importance based on regression analysis
Tools and Libraries
The following tools and libraries are used in the digitisation and analysis:
Datasets
Datasets Provided:
| Dataset
|
Rationale
|
| Traced Map |
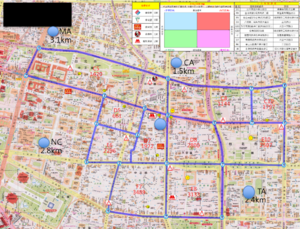
- The client provided us with powerpoint files of manually drawn trade areas. These maps contain the various zones within the trade area, competitors, nearby stores as well as the drive time between each spots in the main road.
- The five competitors defined by the client are:
- Dominos
- Napoleon
- Mcdonalds
- Kentucky Fried Chicken
- Mos Burger
|
| Geospatial Data |
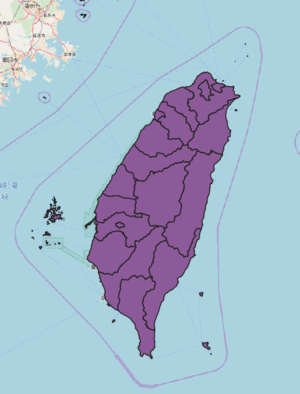
- The client provided us SHP files that contains information about Counties found in Taiwan
| Column |
Description |
Example
|
| COUNTYID |
Unique ID of each County |
“U”
|
| COUNTYCODE |
Unique numerical ID of each County |
10015
|
| COUNTYNAME |
Name of the County in Mandarin |
“台北市”
|
| COUNTYENG |
Name of the County in English |
“Taipei City”
|
|
| Town Area |
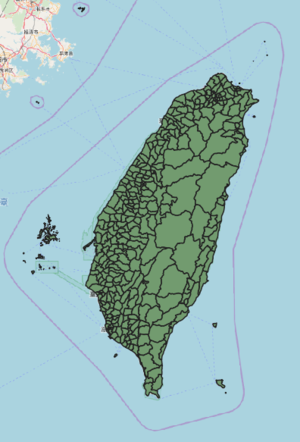
- The client provided us SHP files that contains information about Towns found in Taiwan
| Column |
Description |
Example
|
| VILLCODE |
Unique numerical ID of each Village |
65000050041
|
| VILLNAME |
Name of the Village in Mandarin |
“甲仙區”
|
| VILLENG |
Name of the Village in English |
“Jiasian”
|
| TOWNID |
Unique ID of each Town |
“K12”
|
| TOWNCODE |
Unique numerical ID of each town |
10005060
|
| TOWNNAME |
Name of the Town in Mandarin |
“半線城”
|
| COUNTYID |
Unique ID of each County |
“U”
|
| COUNTYCODE |
Unique numerical ID of each Countyy |
10015
|
| COUNTYNAME |
Name of the County in Mandarin |
“台北市”
|
| NOTE |
Miscellaneous notes |
NIL
|
|
| Village Area |
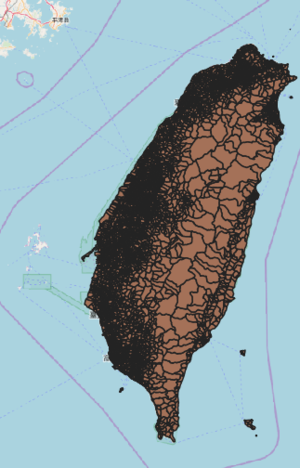
- The client provided us SHP files that contains information about Villages found in Taiwan
| Column |
Description |
Example
|
| TOWNID |
Unique ID of each Town |
“K12”
|
| TOWNCODE |
Unique numerical ID of each town |
10005060
|
| TOWNNAME |
Name of the Town in Mandarin |
“半線城”
|
| TOWNENG |
Name of the Town in English |
“Bamboo Town”
|
| COUNTYID |
Unique ID of each County |
“U”
|
| COUNTYCODE |
Unique numerical ID of each County |
10015
|
| COUNTYNAME |
Name of the County in Mandarin |
“台北市”
|
|
| Taiwan Stores |
- The client provided us a GeoPackage that contains information about each Pizza Hut Store
| Column |
Description |
Example
|
| fid |
Unique ID of each Town |
“K12”
|
| Country |
Unique numerical ID of each town |
10005060
|
| Market |
Name of the Town in Mandarin |
“半線城”
|
| PH/PHD |
Name of the Town in English |
“Bamboo Town”
|
| Status |
Unique ID of each County |
“U”
|
| Milestone |
Unique numerical ID of each County |
10015
|
| Local Code |
Name of the County in Mandarin |
“台北市”
|
| CHAMPS Code |
Name of the Town in English |
“Bamboo Town”
|
| JDE Code |
Unique ID of each County |
“U”
|
| Store Name |
Unique numerical ID of each County |
10015
|
| Latest Asset Type |
Name of the County in Mandarin |
“台北市”
|
| Facility Type |
Name of the Town in English |
“Bamboo Town”
|
| City Location |
Unique ID of each County |
“U”
|
| Location Type |
Unique numerical ID of each County |
10015
|
| Open Date |
Name of the County in Mandarin |
“台北市”
|
| Close Date |
Unique numerical ID of each County |
10015
|
| Corresponding Relo-Open / Relo-Closure Store Name |
Name of the County in Mandarin |
“台北市”
|
| Corresponding Relo-Open / Relo-Closure Date |
Unique numerical ID of each County |
10015
|
| Corresponding Relo-Open / Relo-Closure Asset Type |
Name of the County in Mandarin |
“台北市”
|
| Store Address |
Address of the store |
B1 & 1F., No. 52-1, Hsin Sheng S. Rd., Sec. 1, Taipei, Taiwan (R.O.C)
|
| Latitude |
Latitude of the store |
25.041601
|
| Longitude |
Longitude of the store |
121.532475
|
| Month |
Month of the opening date of the store |
10
|
| Quarter |
Quarter of the opening date of the store |
Q4
|
| Year |
Year of the opening date of the store |
FY1995
|
| Grouping |
Used to denote which group these stores were assigned to |
G1 Group 10
|
| Cluster ID |
Used to denote which group these stores were assigned to, in numerical value |
6
|
|
| POIs |
- The client provided us SHP files that contains information about each POI. We used 32 out of the 86 POI SHPs given. They are:
- ATM
- BANK
- BAR OR PUB
- BOOKSTORE
- BOWLING CENTRE
- BUS STATION
- BUSINESS FACILITY
- CINEMA
- CLOTHING STORE
- COFFEE SHOP
- COMMUTER RAIL STATION
- CONSUMER ELECTRONICS STORE
- CONVENIENCE STORE
- DEPARTMENT STORE
- INDUSTRIAL ZONE
- GOVERNMENT OFFICE
- GROCERY STORE
- HIGHER EDUCATION
- HOSPITAL
- HOTEL
- MEDICAL SERVICE
- NIGHTLIFE
- PERFORMING ARTS
- PHARMACY
- RESIDENTIAL AREA/BUILDING
- RESTAURANT
- SCHOOL
- SHOPPING
- SPECIALITY STORE
- SPORTS CENTRE
- SPORTS COMPLEX
- TRAIN STATION
| Column |
Description |
Example
|
| fid |
Unique numerical ID of each POI type |
25
|
| LINK_ID |
Unsure |
969985784
|
| POI_ID |
Unique numerical ID for each POI |
1201865541
|
| SEQ_NUM |
Unsure |
1
|
| FAC_TYPE |
Numerical ID for facility type |
9853
|
| POI_NAME |
Name of the POI |
“王牙科”
|
| POI_LANGCD |
Unsure |
“CHT”
|
| POI_NMTYPE |
Unsure |
“B”
|
| POI_ST_NUM |
Unsure |
91
|
| ST_NUM_FUL |
Unsure |
124-1
|
| ST_NFUL_LC |
Unsure |
“CHT”
|
| ST_NAME |
Name of ST |
“中和路”
|
| ST_LANGCD |
Unsure |
“CHT”
|
| POI_ST_SD |
Unsure |
“L”
|
| ACC_TYPE |
Unsure |
NIL
|
| PH_NUMBER |
Unsure |
3-5281997
|
| CHAIN_ID |
Unsure |
0
|
| NAT_IMPORT |
Unsure |
“N”
|
| PRIVATE |
Unsure |
“N”
|
| IN_VICIN |
Unsure |
“N”
|
| NUM_PARENT |
Unsure |
0
|
| NUM_CHILD |
Unsure |
0
|
| PERCFRREF |
Unsure |
40
|
| VANCITY_ID |
Unsure |
0
|
| ACT_ADDR |
Unsure |
NIL
|
| ACT_LANGCD |
Unsure |
NIL
|
| ACT_ST_NAM |
Unsure |
NIL
|
| ACT_ADMIN |
Unsure |
NIL
|
| ACT_POSTAL |
Unsure |
NIL
|
| ENTR_TYPE |
Unsure |
NIL
|
|
| Competitor POI’s |
- The client also provided us SHP files that contains information about each individual store from 5 clients. The data has the same attributes as POIs (refer to above), with an addition column:
| Column |
Description |
Example
|
| FOOD_TYPE |
Type of food Competitor sells |
“FAST FOOD”
|
|
| Taiwan Road |
| Column |
Description |
Example
|
| osm_id |
Unique ID of the road |
25
|
| name |
Name of the road |
Alley 43-33, Ln. 361, Jieshou Rd. Sec. 2
|
| ref |
Unsure |
4
|
| type |
The type of road |
“primary”
|
| oneway |
One hot encoded, 1 = oneway 0 = not oneway |
1
|
| bridge |
One hot encoded,, 1 = road on bridge 0 = not on bridge |
0
|
| tunnel |
One hot encoded, 1 = road in a tunnel = 0 not in tunnel |
0
|
| maxspeed |
Max allowed speed on road |
90
|
|
| Sales Data |
- The client gave us a CSV file containing yearly sales information of each region, further broken down into zone
| Column |
Description |
Example
|
| Zone |
Name of the Zone |
“D-05”
|
| Bills |
Numerical value of bills |
666
|
| Bills % |
Percentage of total number of bills |
24.46
|
| Amount |
Total monetary amount of sales |
450182
|
| Amount % |
Percentage of Total monetary amount of sales |
23.88
|
| Ave Bill |
Average monetary amount from sales |
675.95
|
| Shop Code Sales |
String used to denote shop code |
“AE”
|
|
| Population Data |
- We obtained population data with regards to Taiwan online. The XLS file contains population Data is from the year 2010 and is in, uncleaned table format XLS. This was used as an addition feature in our analysis.
- Obtained from https://census.dgbas.gov.tw/PHC2010/english/rehome.htm
| Number of resident population: Grand total |
Total number of residents, male + female |
23123866
|
| Number of resident population: Male |
Total number of male residents |
11489285
|
| Number of resident population: Female |
Total number of female residents |
11634581
|
| Total Land Area (km2) |
Total monetary amount of sales |
36191.5
|
| Population Density (person/km2) |
Percentage of Total monetary amount of sales |
638.9
|
| By Country/City |
Country/City the row of data belongs to |
“Taipei City”
|
|
Foreseen Technical Challenges
We encountered the following technical challenges throughout the course of the project. We have indicated our proposed solutions, and the outcomes of the solutions.
| Key Technical Challenges
|
Proposed Solution
|
Outcome
|
| Data is already pre-aggregated to display monthly sales
|
- The dataset is given directly to us from IFC, and we are unable to change it. Thus, We shall utilize and do our best with the available data.
|
NA
|
| Unfamiliarity in Python integration with QGIS regarding creation of data processing scripts
|
- Watching video tutorials about Python and QGIS
- Independent learning on the design and syntax
- Peer learning and sharing
|
We managed to start using the languages quickly and suit our own project needs.
Each of us work on different parts such as setting up, designing, logic and deployment.
This speeds up our project progress.
|
| Data Cleaning & Transformation Proposed Solution
|
- Having a systematic process while working together in order to maximise efficiency e.g. taking turns to clean, transform and perform checks on the data to ensure accuracy
|
The adopted process was having clear instructions issued to each member in the team, along with maintaining constant communication with each other. In the event that the dataset is deemed too dirty to be usable, it was dropped along with sourcing for new data that would be a suitable replacement.
|
| Lack of geospatial knowledge to understand the dataset initially
|
- Attend SMT201 class to learn more, as well as reading up on resources given by Prof Kam to gain further contextual knowledge
|
NA
|
| Digitising of trade areas from powerpoint slide to QGIS
|
- The process is manual and we had to put in a lot of effort to convert the drawn polygon to data points in QGIS.
|
The data points can better allow us to generate insights on the profile of each outlet via its trade area.
|
| Integrating Relevant Data from Multiple Sources Proposed Solution
|
- Working together to decide on what data to extract or eliminate
|
NA
|
Scope of work
| Kelvin Chia Sen Wei
|
Linus Cheng Xin Wei
|
Eugene Choy Wen Jie
|
|
Data Cleaner in Python
Wiki Writer/Editor
Chart Creator
Map Digitizer 1
Report Writer 1
|
Project Manager
Content Checker
Poster man
Map Digitizer 2
Report Writer 2
|
Data Cleaner in Excel
QGIS Manager
Map Creator
Map Digitizer 3
Report Writer 3
|
Project Schedule
References
Feel free to leave comments / suggestions!

