Difference between revisions of "SMT201 AY2019-20G2 Ex1 Lee Sean Jin"
Jump to navigation
Jump to search


| Line 5: | Line 5: | ||
I used the SVG symbols taught previously in the Hand's On exercises to categorize the schools. The types of schools are a form of categorical data, thus they can be differentiated from each other by unique symbols of different colours. I chose grey as the map base so that the bright coloured and black symbols can be easily identified on the map. This is so that the viewer can identify any trends and patterns at a glance. The increased the size of the symbols to increase their visibility as I found that the symbols were too small even when the map was zoomed in. | I used the SVG symbols taught previously in the Hand's On exercises to categorize the schools. The types of schools are a form of categorical data, thus they can be differentiated from each other by unique symbols of different colours. I chose grey as the map base so that the bright coloured and black symbols can be easily identified on the map. This is so that the viewer can identify any trends and patterns at a glance. The increased the size of the symbols to increase their visibility as I found that the symbols were too small even when the map was zoomed in. | ||
<br> | <br> | ||
| − | + | === Singapore's Road Network System === | |
| + | [[File:Thematic map showing the hierarchy of road network system of Singapore.png|800px|center]] | ||
| + | <br> | ||
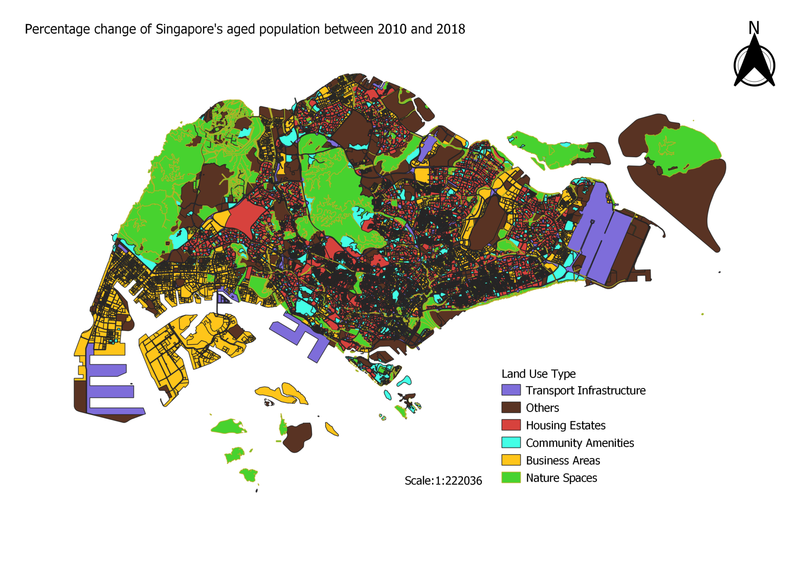
=== Singapore 2014 Master Plan Land Use === | === Singapore 2014 Master Plan Land Use === | ||
[[File:LandUse.png|800px|center]] | [[File:LandUse.png|800px|center]] | ||
<br> | <br> | ||
| − | |||
| − | |||
| − | |||
| − | |||
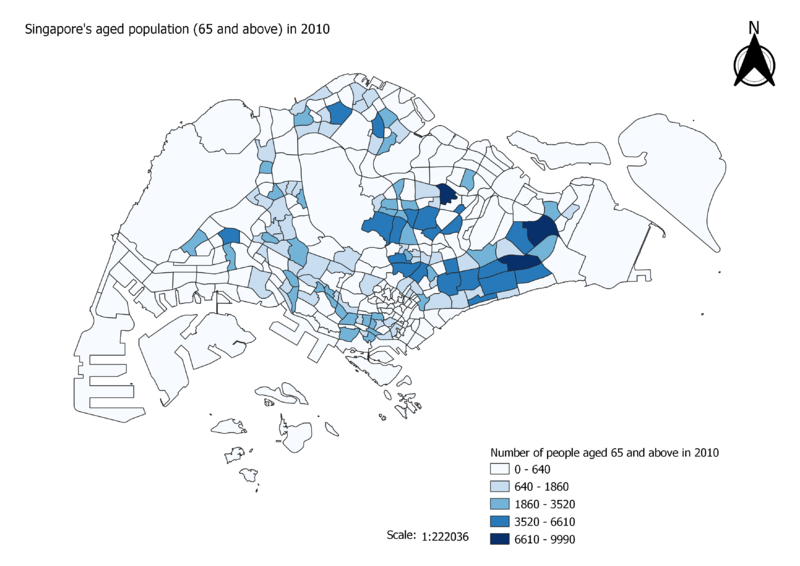
== Part Two: Choropleth Mapping == | == Part Two: Choropleth Mapping == | ||
Revision as of 23:36, 14 September 2019
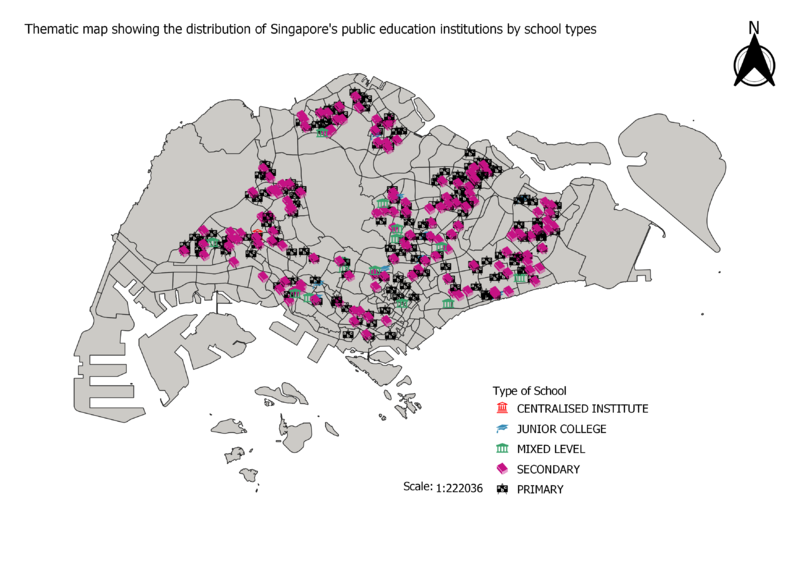
Part One: Thematic Mapping
Distribution of Public Education Institutions in Singapore

I used the SVG symbols taught previously in the Hand's On exercises to categorize the schools. The types of schools are a form of categorical data, thus they can be differentiated from each other by unique symbols of different colours. I chose grey as the map base so that the bright coloured and black symbols can be easily identified on the map. This is so that the viewer can identify any trends and patterns at a glance. The increased the size of the symbols to increase their visibility as I found that the symbols were too small even when the map was zoomed in.
Singapore's Road Network System

Singapore 2014 Master Plan Land Use

Part Two: Choropleth Mapping
Singapore's Aged Population (65 and above) in 2010
_in_2010.png)
Singapore's Aged Population (65 and above) in 2018
_in_2018.png)
Singapore's Proportion of Aged Population (65 and above) in 2010
_in_2010.png)
Singapore's Proportion of Aged Population (65 and above) in 2018
_in_2018.png)
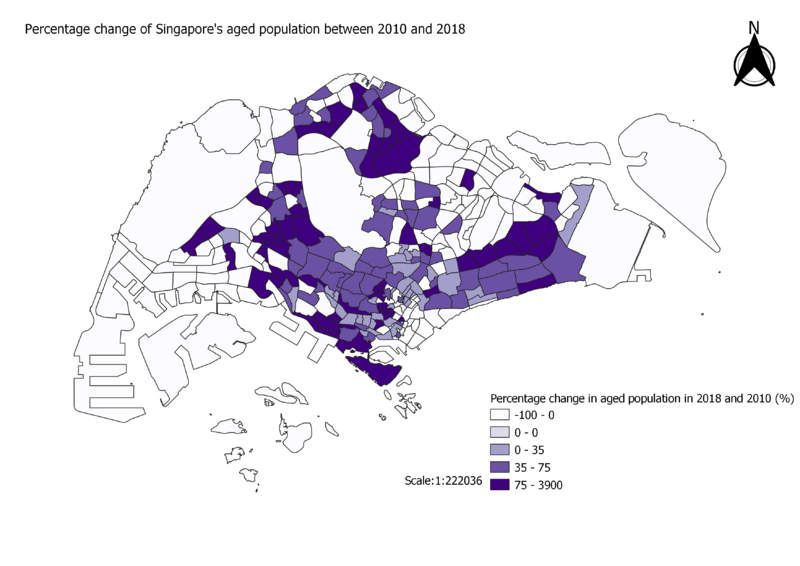
Percentage Change From 2010 and 2018
