Difference between revisions of "SMT201 AY2018-19T1 EX1 Ho Xin Yi"
Jump to navigation
Jump to search
Singapore Public Educational Institution by School Type
Singapore Road Network System
2014 Master Plan Landuse
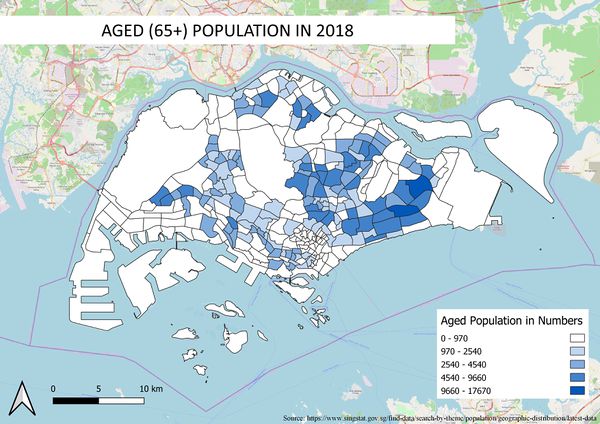
Aged population (+65) in 2010 and 2018
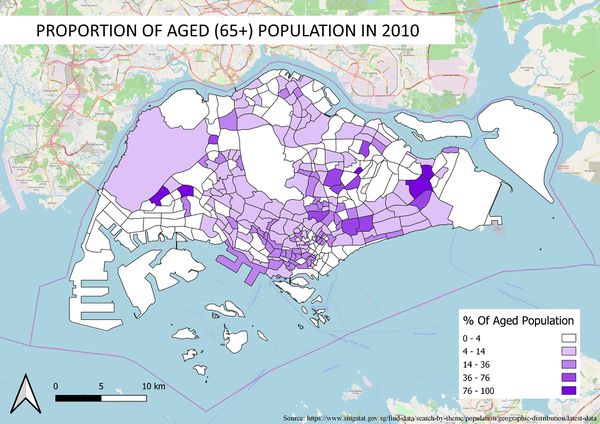
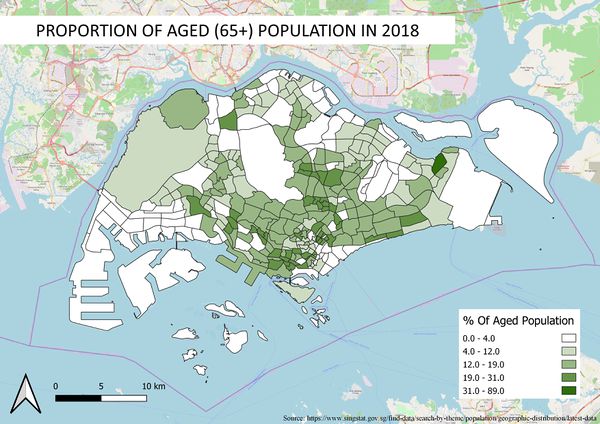
Proportional of aged population in 2010 and 2018
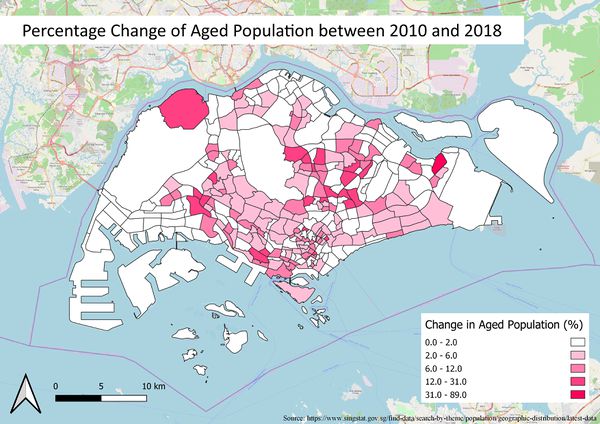
Percentage change of aged population between 2010 and 2018
| Line 1: | Line 1: | ||
== Part 1: Thematic Mapping == | == Part 1: Thematic Mapping == | ||
=== Singapore Public Educational Institution by School Type <br> [[File:EducationBySchoolType.jpg|frameless|left|600px|Singapore public educational institution by school type]] === | === Singapore Public Educational Institution by School Type <br> [[File:EducationBySchoolType.jpg|frameless|left|600px|Singapore public educational institution by school type]] === | ||
| + | |||
| + | By reading through the data sourced from data.gov.sg, I find that the 'MainLevel' variable could be used since it classifies the data into many different types of school such as Centralised Institute, <br> Junior college, Mixed level, Primary and Secondary school. Next, under symbology, I used categorized as it is best suited for school type which is under qualitative data. In addition, I chose to use SVG markers <br> instead of simple markers to allow the different school type to be differentiated clearly. School type that is not dominated is also set with more striking colors symbol to allow the ease of locating them e.g. mixed level. | ||
=== Singapore Road Network System <br> [[File:SingaporeRoadNetworkSystem.png|frameless|left|600px|Singapore Road Network System]] === | === Singapore Road Network System <br> [[File:SingaporeRoadNetworkSystem.png|frameless|left|600px|Singapore Road Network System]] === | ||
Revision as of 23:16, 15 September 2019
Part 1: Thematic Mapping
Singapore Public Educational Institution by School Type
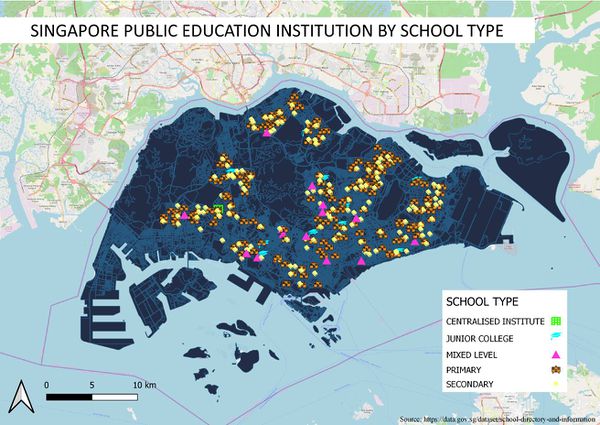

By reading through the data sourced from data.gov.sg, I find that the 'MainLevel' variable could be used since it classifies the data into many different types of school such as Centralised Institute,
Junior college, Mixed level, Primary and Secondary school. Next, under symbology, I used categorized as it is best suited for school type which is under qualitative data. In addition, I chose to use SVG markers
instead of simple markers to allow the different school type to be differentiated clearly. School type that is not dominated is also set with more striking colors symbol to allow the ease of locating them e.g. mixed level.
Singapore Road Network System


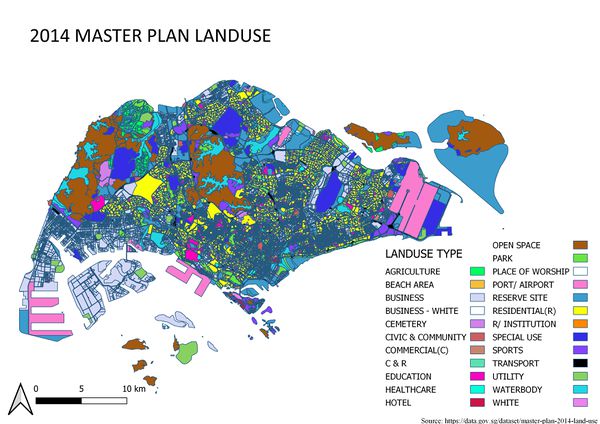
2014 Master Plan Landuse

Part 2: Choropleth Mapping
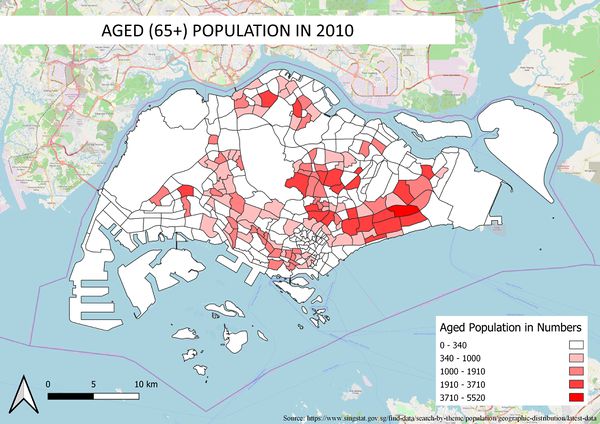
Aged population (+65) in 2010 and 2018


Proportional of aged population in 2010 and 2018


Percentage change of aged population between 2010 and 2018